The New Freshmen Retention and Graduation dashboard is one of the interactive resources developed by UWM’s Office of Assessment and Institutional Research (OAIR). The key question that the dashboard can address for all students or for students in specific schools/colleges: What factors might align with student success, and what do those factors suggest about where we might put additional support?
The dashboard tracks retention and graduation rates of freshmen students at the main campus (an updated version of the dashboard with data from the branch campuses is being developed) from the first semester they enrolled out for six years. It shows percentages of students that are:
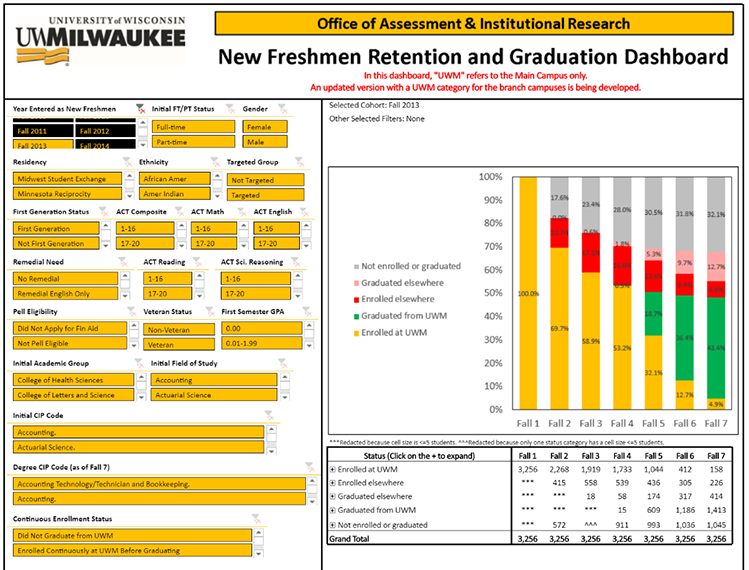
- Still enrolled at UWM
- Graduated from UWM
- Enrolled elsewhere
- Graduated elsewhere
- Not enrolled or graduated
In the default view that displays when the dashboard loads, we can see that for new freshmen students who enrolled in Fall 2013, 4.9% are still enrolled; 43.4% have graduated from UWM; 6.9% were enrolled elsewhere; 12.7% had graduated elsewhere; and 32.1% of students have neither enrolled nor graduated from anywhere (based on information available in the National Student Clearinghouse). First–year retention for this cohort was 69.7%; for comparison, first-year retention for new freshmen students in Fall 2018 was 75.5%.
In addition to presenting year of entry and FT/PT status, the dashboard allows you to view and interact with the following categories:
- Demographics (gender, ethnicity, residence status)
- Schools/colleges and field of study upon entry and ongoing
- Specific populations: first-generation; Pell eligible, remedial instruction eligible; veterans
- Composite ACT scores and subscores
- First-semester GPA
This dashboard can help administrators target hurdles to retention and graduation and align our resources and efforts with the challenges that most hinder the progress of our students.