The U.S. census has for more than two centuries been an astonishing tool for America’s self-discovery. Margo Anderson, distinguished professor of history at UWM, shows the deep impact the census has had in the country’s life. The use of census data for military strategy during the Civil War is a remarkable example of the breadth of the census’ utility.
The most obvious use of the census during the war was as an instrument to measure the relative military strength of the Union and the Confederacy. On the heels of Fort Sumter, Kennedy sent a report to Lincoln listing the number of white men aged eighteen to forty-five in the free states, the “border slave” states (those that had not seceded), the seceded states, and the territories. Of the 5.5 million men of military age, 69 percent were in the free states. The seceded states could muster 9 percent. If all the remaining slave states joined the Confederacy, it could draw on another 1.1 million men. The prospects for the Union looked quite good. Similarly, over the next few months, Kennedy responded to requests from Lincoln asking for information about the capabilities of the Confederacy to manufacture saltpeter or sulfur for explosives. In January 1862 Congress passed a joint resolution on “war statistics” authorizing Kennedy to report data directly to the War Department. For the remainder of the war, the Census Office loaned clerks to the War Department for statistical work and performed such work in the Census Office itself. As Kennedy recalled after the war, his staff had tallied and published the basic tables in the eighth census reports (five volumes) at the same time that they prepared “maps of each state by counties and congressional districts . . . for the Provost Marshal General,” and “table after table of military apportionment demanded by differences of opinion between state and city authorities and the War Department.” They also prepared “statistical maps for Generals in the field and military governors.” Kennedy’s staff used postal route maps for counties in the South and annotated them with the results of the 1860 census. On the face of the map, data were written in for each county. Thus, for example, Northern commanders had data on the number of whites, free colored, and slaves for each county. They also knew the amount of improved land, the number of horses and mules, and the quantity of wheat, corn, oats, and other crops produced in the county.
General William Tecumseh Sherman made the most notable use of such statistical information in his march through Georgia to the sea. Sherman acknowledged his debt to the Census Office for the information both at the time and after the war. “No military expedition was ever based on sounder or surer data,” he wrote to his daughter Ellen. The data made it possible for Northern commanders to operate with short or no supply lines, to live off the land, and thus to move faster than traditional armies.
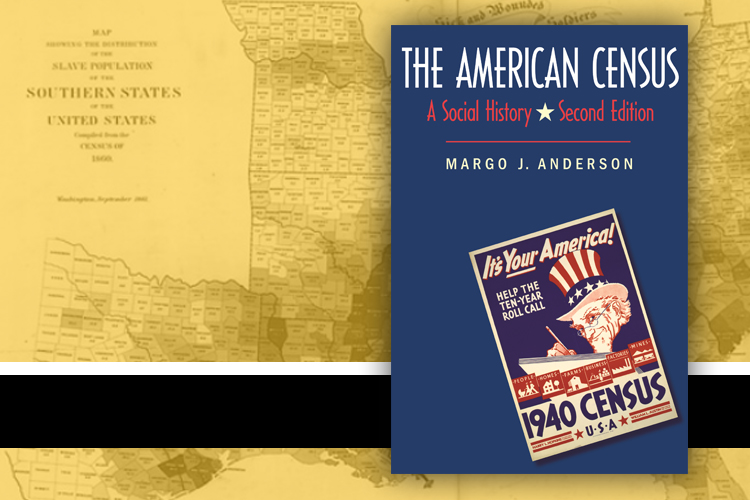
A second major use of census information came in the form of the publication of demographic maps of the distribution of the slave population by county in the Southern states. In the summer of 1861, the Coast Survey and the Census Office, both offices in the Interior Department, initially partnered to produce a map of Virginia showing the “distribution of its slave population.” They produced a comparable map of all the Southern states in September 1861. Both maps were “Sold for the benefit of the Sick and Wounded Soldiers of the U.S. Army.” Demographic mapping was a new cartographic innovation at the time. On the most basic level, as Susan Schulten has shown, these maps indicate the emergence of a new method of “envisioning” information, using Edward Tufte’s phrase.
These maps were also expressly used in the policy debates on war strategy. By illustrating the relative strength and dispersion of the slave population in particular areas, they revealed the overlap between the relative strength of Confederate sentiment and the density of the slave population. The Virginia map was originally drawn and redrawn as the northwestern counties of Virginia resisted secession and eventually split off to form the state of West Virginia. Abraham Lincoln kept the Southern states map in his office throughout the Civil War, and it was memorialized in Francis Bicknell Carpenter’s painting “First Reading of the Emancipation Proclamation of President Lincoln” (1864).
The Civil War also revived questions about the tax capacity of the nation and the role of direct versus other forms of taxation. In the summer of 1861 Congress and the Treasury Department faced the problem of financing the war. Secretary of the Treasury Salmon P. Chase recommended a variety of taxes, including modest increases in tariffs and excise duties and a direct tax apportioned among the states. Congress and the administration were relatively inexperienced in questions of taxation because the tariff had conveniently supplied all the federal revenue for the previous twenty years. Only as the war progressed did the difficulties of taxation and finance emerge as the massive problems they would later become.
For precedents for the direct tax, Congress literally returned to the statutory language used during the War of 1812 and apportioned twenty million dollars among the states—including the seceded states. The tax was apportioned on the basis of the representative population—that is, all free persons and three-fifths of the slave population—and was assessed on landed property. As it debated the bill, Congress began to recognize the difficulties with the proposed tax. How would the tax be collected in the insurrectionary states? What about the radically different values of assessed property between the older and richer states in the East and the developing West? Western states would pay a much higher relative levy than would eastern ones. These difficulties prompted Congress to try to modify the tax. Legislators provided for the sale of rebel property to pay the tax. They also levied the first federal income tax to balance the burden of the direct tax in the West. Lawmakers agreed that the income tax would fall most heavily on the citizens in the East, where incomes were higher. The income tax—not apportioned among the states on the basis of the census—was initially a tax of 3 percent on incomes above $800 a year. Between 1862 and 1865, the tax was expanded to a 5 percent levy of incomes between $600 and $5,000; incomes above $5,000 were taxed at 10 percent. After the war, the tax was reduced and then abolished in 1872.
As it turned out, these modifications of the direct tax proposal had the greatest impact on the nation and on future national tax policy. The Civil War income tax generated $347 million over its existence, the direct tax just $15 million before its repeal. The income tax showed itself to be a powerful revenue generator, the direct tax a feeble one. The Civil War income tax had a distinctly sectional impact. Seventy percent of the tax was collected from residents in California, Connecticut, Massachusetts, New York, New Jersey, Maryland, Pennsylvania, and Rhode Island. (By way of comparison, these states accounted for about 30 percent of the population.) The direct tax was collected only in the loyal states, and the states themselves generally paid the tax, as they had during the War of 1812. Further, because the states were also charged with raising and provisioning troops for the Union Army, state officials quickly discovered that they could offset some of their quotas for services and equipment against the state’s direct tax bill. The direct tax thus added no new revenue to the federal treasury.
Collecting the tax in the insurrectionary states was another matter. Collection was feasible only in areas where the Union Army had established federal control. In most parts of the South, the tax went unpaid. But in several celebrated experiments, notably in the Sea Islands of South Carolina, federal officials seized plantation lands for unpaid taxes and used them to undertake dramatic experiments in reconstructing the Southern social and economic system, including distributing valuable land to former slaves. These experiments created further problems after the war as former landowners returned to claim their lands.
![“Map Showing the Distribution of the Slave Population of the Southern States of the United States . . . 1860.” This 1861 map was one of the earliest census efforts to illustrate population pat- terns for the general public. (Library of Congress, Geography and Map Division, Drawn by E. Hergesheimer, Engr. by Th. Leonhardt [Washington, DC: Henry S. Graham, 1861])](https://uwm.edu/news/wp-content/uploads/sites/41/2016/05/slave_population_map_750.jpg)
From “The American Census: A Social History,” 2nd ed., by Margo J. Anderson. Copyright © 2015 by Margo J. Anderson. Excerpted by permission of Yale University Press. All rights reserved. No part of this excerpt may be reproduced or reprinted without permission in writing from the publisher.


