Meteorologist Jonathan Kahl turned a sports tool into a way of looking at weather patterns, and found his work gain rapid popularity on social media.
Kahl, professor of atmospheric science in the UWM School of Freshwater Sciences, adapted the idea of “scorigami,” a way of looking at the mathematics of sports scores, to weather. He dubbed it “weathergami.”
The basic idea of scorigami – created by sportswriter Jon Bois – is to chart the scores in a sport to see how often score combinations appear. A scorigami is when a score appears for the first time. Applying the idea to football, for example, more than 1,000 different final scores have been achieved since the National Football League was formed in 1920. One just happened on New Year’s Eve: The Baltimore Ravens’ 56-19 victory over the Miami Dolphins was a scorigami.
Weathergami got started a few years ago when Kahl’s son called with a question. “He asked me if there’s anything like scorigami in weather. My response to that was, ‘what’s scorigami?’”
After his son explained the concept, Kahl was intrigued by the idea. He did some research charting the high and low temperatures in Milwaukee during different seasons, using 80 years of historical weather data.
Kahl started charting a few more locations. “I thought not only does this look interesting, but you can actually see things about the weather and climate of a place using these kind of charts that are difficult or even impossible to see using other modes of display. So, I thought it was pretty cool, and wrote it up into a paper.”
His research article on weathergami was published in the Bulletin of the American Meteorological Society in October. The response amazed Kahl.
Two or three weeks after the article was published, Twitter (now known as X) discovered it.
“It has kind of exploded on Twitter,” Kahl said.
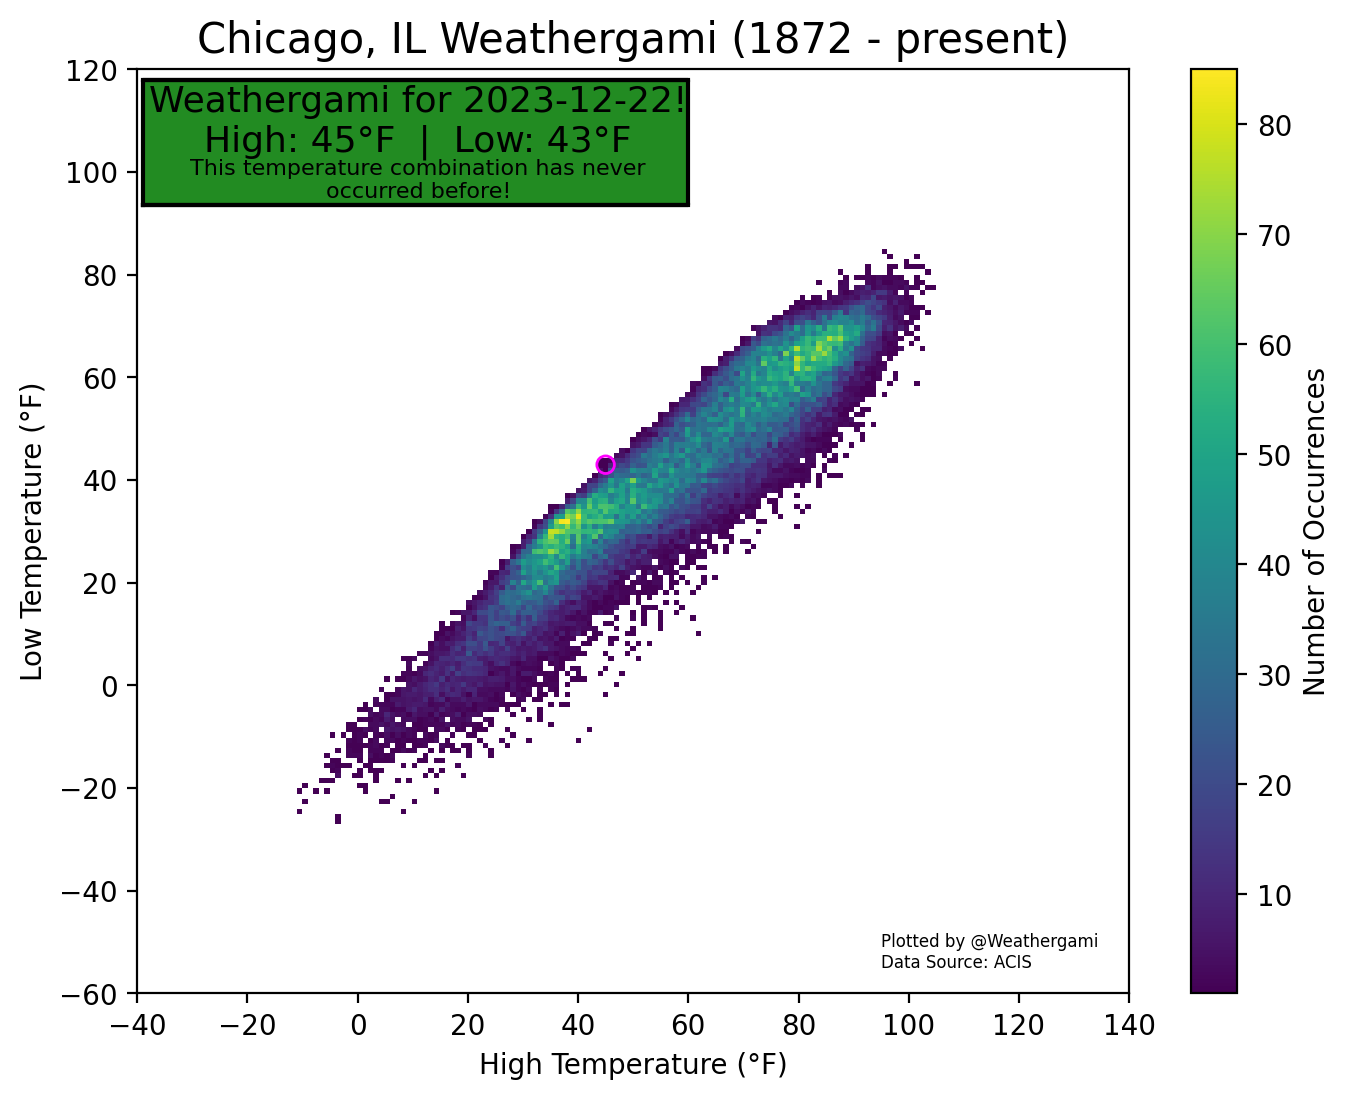
Using a checkerboard layout, with low temperatures shown vertically and high temperatures horizontally, he color-coded the different temperature combinations in four cities through the seasons. In Chicago, for example, the chart could show visually how often a high of 90 and a low of 75 occurred during the summer.
The charts show how many times a certain high-low combination has occurred in a more visual way than a line graph. “A weathergami, according to my definition, is when you get a combination that has never occurred before,” Kahl said.
Over 5,000 on Twitter
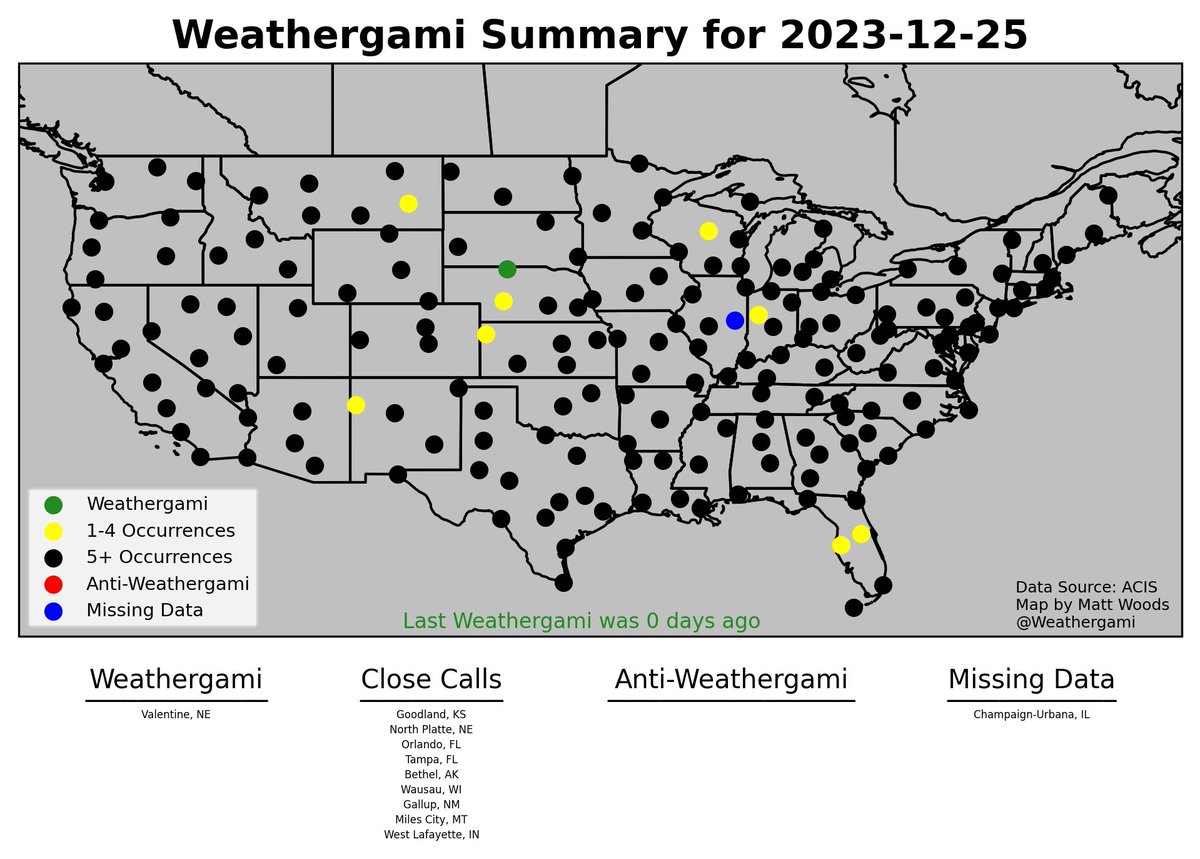
Interested followers created a page on X with the handle @Weathergami, which already has nearly 6,000 followers. One follower created software that looks at around 200 weather data sites every day, and another created a Python program that other users could use to create their own weathergami charts. The Python software, which is open-source and freely available, allows users to access climate data and plot weathergami charts for any location.
“The Twitter people who have latched onto this idea have taken it in some interesting directions, like one guy invented the idea of a of an anti-weathergami,” Kahl said. “According to him, that’s when a high-low temperature combination that happens most frequently occurs.”
Another follower invented the “ultra weathergami,” for when a combination occurs that has never happened anywhere.
Kahl is surprised at the reaction but pleased that it’s getting people interested in climate and weather. “They’re interested in the ‘gosh, gee whiz’ novelty of it because it is kind of fun to look at those charts like I showed in the paper. The world so far has noticed only the novelty.”
Research opportunities
Kahl, however, sees research opportunities to look at weather and climate patterns differently.
“You can investigate in this day and age of global warming, whether the high temperatures and low temperatures of the day are increasing at the same rates, and whether these temperature changes are different for cold days versus warm days.”
The charts for some cities showed the data moving up and to the right, indicating overall warming. However, a chart for San Francisco showed that while the coldest temperatures were rising, the warmest temperatures were not changing very much.
“That’s the kind of observation you can’t make from traditional ways of looking at climate change,” Kahl said.
When students are taught about climate, he added, they use a figure with a bar graph showing monthly precipitation amounts and a line graph showing average temperatures for each month.
“That’s fine. It’s illustrative of the climates of different places. But if you add a weathergami chart to the mix, you get a lot of different information.”
Frequency of changes
He’s also created weathergami charts to show the frequency of daily changes in high and low temperatures, which can be plotted to show information on the variability of the weather.
For example, in a place like Honolulu, the weather pretty much never changes, he said. “You know the high temperature one day is almost exactly the same as the high temperature on the previous day. Whereas you know in Milwaukee, that’s not the case. We often have wild temperature swings.”
Another variation, a weathergami anomaly chart, can reveal characteristics of changing climate not evident in standard time series representations, according to Kahl.
In January, he headed to Mexico to lead a study abroad program over the winter break. So, he’s planning a project to use weathergami to enhance standard climate classification charts showing temperatures and precipitation in areas of the U.S. and Mexico.
“I want to see how much information can be gained by including weathergami charts. I suspect that with many climate types, that will add some information that goes beyond what is available from those traditional bar and line graphs.”