Wisconsin 30 Index

The Wisconsin 30 Index is an equal-weighted stock index that is updated annually on December 31.
The index was originally constructed to reflect the 30 largest Wisconsin stocks based on market capitalization. The index is rebalanced on an annual basis to reflect year-end market capitalizations. Returns prior to 12/31/24 are based on the original constituents looking backward, with adjustments if a name did not exist in earlier periods.
Wisconsin 30 Companies
Listed in order of market value as of December 31, 2024
| Ticker | Company | Market Value (Millions) |
|---|---|---|
| FI | Fiserv, Inc. | 116,867 |
| ROK | Rockwell Automation, Inc. | 32,315 |
| WEC | WEC Energy Group, Inc. | 29,875 |
| SNA | Snap-on Incorporated | 17,819 |
| LNT | Alliant Energy Corporation | 15,175 |
| EXAS | Exact Sciences Corporation | 10,399 |
| RRX | Regal Rexnord Corporation | 10,274 |
| AOS | A.O. Smith Corporation | 9,890 |
| GNRC | Generac Holdings Inc. | 9,225 |
| ZWS | Zurn Elkay Water Solutions Corporation | 6,330 |
| BMI | Badger Meter Corp. | 6,239 |
| KSS | Oshkosh Corp | 6,186 |
| MOD | Modine Manufacturing Company | 6,087 |
| MTG | MGIC Investment Corporation | 6,007 |
| SNDR | Schneider National, Inc. Class B | 5,129 |
| PLXS | Plexus Corp. | 4,239 |
| ASB | Associated Banc-Corp | 3,902 |
| HOG | Harley-Davidson, Inc. | 3,863 |
| BRC | Brady Corporation Class A | 3,527 |
| APAM | Artisan Partners Asset Management, Inc. Class A | 3,459 |
| MGEE | MGE Energy, Inc. | 3,402 |
| SXT | Sensient Technologies Corp. | 3,019 |
| MAN | ManpowerGroup Inc. | 2,709 |
| SPB | Spectrum Brands Holdings, Inc. | 2,308 |
| EPAC | Enerpac Tool Group Corp. Class A | 2,235 |
| REVG | REV Group, Inc. | 1,657 |
| NIC | Nicolet Bankshares, Inc. | 1,596 |
| KSS | Kohl’s Corporation | 1,563 |
| MRTN | Marten Transport, Ltd. | 1,271 |
| BFC | Bank First Corp | 992 |
*Disclaimer: The University of Wisconsin-Milwaukee is not a registered investment, legal, or tax advisor or broker/dealer. This work was completed by students in the Investment Management Certificate program in UWM’s Lubar College of Business under faculty supervision. All investment/financial opinions expressed are from their research and are intended as educational material. Although best efforts are made to ensure that all information is accurate and up to date, occasional unintended errors or misprints may occur.
Index Outlook
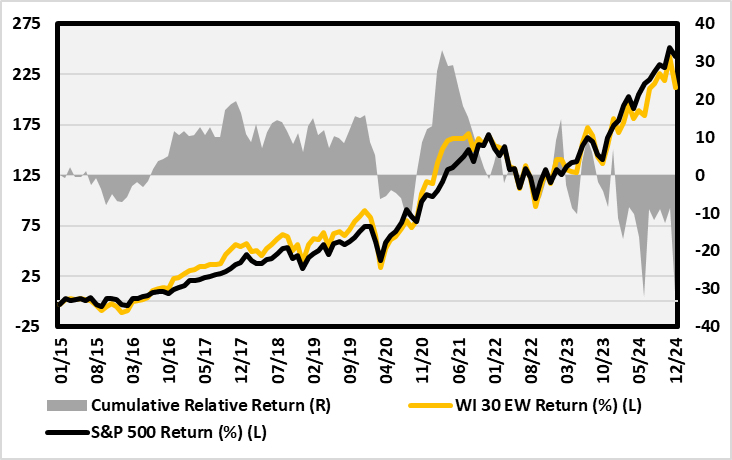
The Wisconsin 30 Index has outperformed the S&P 500 over the last 10 years, but it has underperformed more recently.
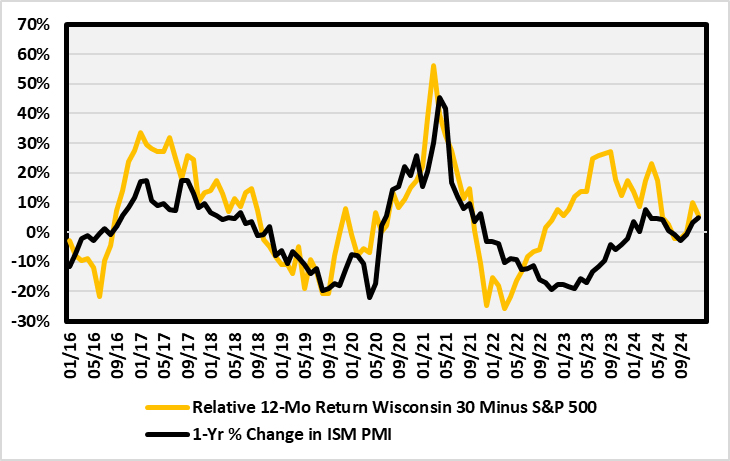
The equal-weight Wisconsin 30 Index has smaller and more economically sensitive companies than the S&P 500, so changes in the Institute for Supply Management’s PMI index have a large impact on returns. The PMI index is a survey of manufacturers on growth. The graph highlights the annual change in PMI (or acceleration of deceleration of growth) and returns of the Wisconsin 30 Index versus the S&P 500. As goes the economy, goes the Wisconsin 30 Index.
Index Performance
The Wisconsin 30 index under-performed the S&P 500 on a 1-, 2-, 3-, and 5-year basis, but outperformed over 10 years.
| Period | Wisconsin 30 | S&P 500 | Difference |
|---|---|---|---|
| 1-Year | 10.9% | 25.0% | -14.1% |
| 2-Year | 44.0% | 57.9% | -13.9% |
| 3-Year | 17.9% | 29.3% | -11.3% |
| 5-Year | 64.2% | 97.0% | -32.8% |
| 10-Year | 211.7% | 242.9% | -31.1% |
Top/Bottom Performers
Here are the best and worst performing Wisconsin 30 index stocks for the 12 months ending 12/31/24.
5 Highest Performers
| Ticker | Company | Return |
|---|---|---|
| MOD | Modine Manufacturing Company | 94.2% |
| FI | Fiserv, Inc. | 54.6% |
| PLXS | Plexus Corp. | 44.7% |
| BMI | Badger Meter, Inc. | 38.3% |
| EPAC | Enerpac Tool Group Corp. Class A | 32.3% |
5 Lowest Performers
| Ticker | Company | Return |
|---|---|---|
| LVWR | LiveWire Group, Inc. | -57.5% |
| KSS | Kohl’s Corporation | -45.9% |
| MRTN | Marten Transport, Ltd. | -24.6% |
| MAN | ManpowerGroup Inc. | -24.0% |
| EXAS | Exact Sciences Corporation | -24.0% |
Index Sector Weights
The Wisconsin 30 index is massively overweight industrials and massively underweight healthcare and technology.
| Sector 12/31/2024 | Wisconsin 30 | S&P 500 | Difference |
|---|---|---|---|
| Basic Materials | 3.3% | 1.3% | 2.1% |
| Consumer Discretionary | 6.7% | 15.2% | -8.5% |
| Consumer Staples | 3.3% | 4.1% | -0.8% |
| Energy | 0.0% | 3.2% | -3.2% |
| Financials | 16.7% | 10.5% | 6.1% |
| Health Care | 3.3% | 9.7% | -6.4% |
| Industrials | 50.0% | 11.6% | 38.4% |
| Real Estate | 0.0% | 2.1% | -2.1% |
| Technology | 3.3% | 37.3% | -34.0% |
| Telecommunications | 0.0% | 2.1% | -2.1% |
| Utilities | 10.0% | 2.6% | 7.4% |
| [Unassigned] | 3.3% | 0.2% | 3.1% |
Index Characteristics
The Wisconsin 30 Index has smaller companies than the S&P 500. They are less expensive than the overall market, but they have lower sales growth and profitability.
| Character | Wisconsin 30 | S&P 500 | Difference |
|---|---|---|---|
| Median Market Cap | 4,683 | 36,789 | -32,106 |
| Valuation | |||
| Dividend Yield | 2.16% | 1.26% | 0.91% |
| P/E* | 17.7 | 26.7 | -9.0 |
| P/CF* | 10.4 | 16.9 | -6.6 |
| P/B* | 2.0 | 4.8 | -2.8 |
| P/S* | 0.9 | 3.1 | -2.1 |
| Growth | |||
| 3-yr Sales | 6.9% | 13.9% | -7.0% |
| 3-yr Eps | 6.4% | 18.0% | -11.6% |
| Expected EPS 3-5 year | 4.9% | 14.3% | -9.4% |
| Profitablility | |||
| ROA | 6.9% | 17.1% | -10.2% |
| ROE | 14.4% | 25.7% | -11.3% |
| Net Margin | 11.2% | 21.1% | -9.9% |
| LT Debt/Capital | 27.4% | 38.4% | -10.9% |
Date: 12/31/24