Wisconsin 30 Index

The Wisconsin 30 Index is an equal-weighted stock index that is updated annually on December 31.
The index was originally constructed to reflect the 30 largest Wisconsin stocks based on market capitalization. The index is rebalanced on an annual basis to reflect year-end market capitalizations. Returns prior to 12/31/24 are based on the original constituents looking backward, with adjustments if a name did not exist in earlier periods.
Wisconsin 30 Companies
Listed in order of market value as of December 31, 2024
| State | Rank 12/31/2024 | Ticker | Company | Market Value ($ Millions) 12/31/2024 | Date | Report |
|---|---|---|---|---|---|---|
| WI | 1 | FISV | Fiserv, Inc. | 116,867 | Dec-25 | Click Here for Report |
| WI | 2 | ROK | Rockwell Automation, Inc. | 32,315 | Dec-24 | Available Upon Request |
| WI | 3 | WEC | WEC Energy Group, Inc. | 29,875 | Dec-24 | Click Here for Report |
| WI | 4 | SNA | Snap-on Incorporated | 17,819 | Dec-25 | Click Here for Report |
| WI | 5 | LNT | Alliant Energy Corporation | 15,175 | Dec-25 | Click Here for Report |
| WI | 6 | EXAS | Exact Sciences Corporation | 10,399 | Dec-25 | Click Here for Report |
| WI | 7 | RRX | Regal Rexnord Corporation | 10,274 | Dec-25 | Click Here for Report |
| WI | 8 | AOS | A.O. Smith Corporation | 9,890 | Dec-24 | Available Upon Request |
| WI | 9 | GNRC | Generac Holdings Inc. | 9,225 | Dec-23 | Available Upon Request |
| WI | 10 | ZWS | Zurn Elkay Water Solutions Corporation | 6,330 | Dec-25 | Click Here for Report |
| WI | 11 | BMI | Badger Meter Corp. | 6,239 | Dec-24 | Available Upon Request |
| WI | 12 | OSK | Oshkosh Corp | 6,186 | Dec-23 | Available Upon Request |
| WI | 13 | MOD | Modine Manufacturing Company | 6,087 | ||
| WI | 14 | MTG | MGIC Investment Corporation | 6,007 | Dec-24 | Available Upon Request |
| WI | 15 | SNDR | Schneider National, Inc. Class B | 5,129 | Dec-23 | Available Upon Request |
| WI | 16 | PLXS | Plexus Corp. | 4,239 | Dec-24 | Available Upon Request |
| WI | 17 | ASB | Associated Banc-Corp | 3,902 | ||
| WI | 18 | HOG | Harley-Davidson, Inc. | 3,863 | Dec-24 | Available Upon Request |
| WI | 19 | BRC | Brady Corporation Class A | 3,527 | ||
| WI | 20 | APAM | Artisan Partners Asset Management, Inc. Class A | 3,459 | Dec-23 | Available Upon Request |
| WI | 21 | MGEE | MGE Energy, Inc. | 3,402 | Dec-24 | Available Upon Request |
| WI | 22 | SXT | Sensient Technologies Corp. | 3,019 | Dec-25 | Click Here for Report |
| WI | 23 | MAN | ManpowerGroup Inc. | 2,709 | Dec-25 | Click Here for Report |
| WI | 24 | SPB | Spectrum Brands Holdings, Inc. | 2,308 | ||
| WI | 25 | EPAC | Enerpac Tool Group Corp. Class A | 2,235 | Dec-24 | Available Upon Request |
| WI | 26 | REVG | REV Group, Inc. | 1,657 | Dec-25 | Click Here for Report |
| WI | 27 | NIC | Nicolet Bankshares, Inc. | 1,596 | ||
| WI | 28 | KSS | Kohl’s Corporation | 1,563 | Dec-25 | Click Here for Report |
| WI | 29 | MRTN | Marten Transport, Ltd. | 1,271 | ||
| WI | 30 | BFC | Bank First Corp | 992 |
| Additional Wisconsin Companies | Ticker | Company | Date | Report | ||
|---|---|---|---|---|---|---|
| Wisconsin | DLTH | Duluth Holdings Inc | Dec-24 | Available Upon Request | ||
| Wisconsin | GWW | WW Grainger | Dec-24 | Click Here for Report | ||
| Wisconsin | JOUT | Johnson Outdoors Inc. | Dec-25 | Click Here for Report | ||
| Wisconsin | KOSS | Koss Corporation | Dec-25 | Click Here for Report | ||
| Wisconsin | LE | Lands’ End Inc | Dec-24 | Available Upon Request | ||
| Wisconsin | MTW | The Manitowoc Company, Inc. | Dec-23 | Available Upon Request | ||
| Wisconsin | WEYS | Weyco Group Inc | Dec-24 | Available Upon Request |
| Illinois Companies | Ticker | Company | Date | Report | ||
|---|---|---|---|---|---|---|
| Illinois | UAL | United Airlines Holdings Inc | Dec-25 | Click Here for Report | ||
| Illinois | ZBRA | Zebra Technologies Corporation | Dec-25 | Click Here for Report |
*Disclaimer: The University of Wisconsin-Milwaukee is not a registered investment, legal, or tax advisor or broker/dealer. This work was completed by students in the Investment Management Certificate program in UWM’s Lubar College of Business under faculty supervision. All investment/financial opinions expressed are from their research and are intended as educational material. Although best efforts are made to ensure that all information is accurate and up to date, occasional unintended errors or misprints may occur.
Index Research – Impact of Tariffs
Since the Trump administration took office on January 20th, one word has dominated trade and economic headlines. Tariffs. As a central pillar of the administration’s trade strategy, tariffs have been used both as a negotiating tool and a means of protecting domestic industries. Broad-based measures now include a 10% universal tariff on most imports and a steep 145% tariff on all Chinese goods, however, there has been a recent 90-day pause. While certain strategic exemptions have been granted, such as conditional relief for USMCA partners and exclusions for tech-related imports like smartphones and displays, the overall trade landscape remains volatile. Countries such as China, the EU, and Canada have responded with threats of WTO disputes and retaliatory tariffs, further amplifying global uncertainty. As firms struggle to navigate shifting criteria and unpredictable rate changes, tariffs have become a defining force in international trade policy and a major source of economic risk.
When analyzing the Wisconsin Index, 14 of the 30 companies (Figure 1) fall within the industrials sector, a group highly sensitive to tariffs and global trade disruptions. Due to their cyclical nature, industrials typically underperform during periods of economic uncertainty and slowing growth, making the index particularly vulnerable in the current tariff-heavy environment. This raises an important question: How did the Wisconsin Index respond during the first U.S.-China trade war, and what is it signaling now amid renewed tariff tensions? Understanding this performance history offers valuable insight into how the index may behave as trade policies continue to evolve.
Figure 1: Wisconsin Index Sectors
| Sector | Number of Companies |
|---|---|
| Industrials | 14 |
| Financials | 6 |
| Utilities | 3 |
| Consumer Discretionary | 2 |
| Information Technology | 2 |
| Healthcare | 1 |
| Materials | 1 |
| Consumer Staples | 1 |
The first U.S.-China trade war (2018–2019) was largely strategic and targeted, with tariffs aimed at specific sectors like steel, aluminum, and approximately $360 billion worth of Chinese imports. The Trump administration positioned these measures as leverage to address concerns over intellectual property theft, forced technology transfers, and longstanding trade imbalances. Although the tariffs were impactful, they were relatively focused in scope, and the overall economic disruption was limited where many companies were able to adapt through supply chain adjustments or passed costs on to consumers, resulting in less severe consequences than initially feared. However, let’s see how the Wisconsin Index, specifically industrials, performed during the first trade war (Figure 2).
Figure 2: Wisconsin Index Contribution to Returns (First Trade War)
![Contribution scatter plot by sector, 12/29/2017–12/31/2018. Most sectors cluster near the center. Industrials (circled in red) is the clear outlier, with roughly -25% total return and -7% contribution to return. Health Care and [Unassigned] are the top performers on the right.](https://uwm.edu/business/wp-content/uploads/sites/554/2026/04/imcp-figure-2-wi-index-contribution-to-return.jpg)
During the first trade war, the Wisconsin Index suffered significant losses, with 77% of its holdings, primarily from the Industrials, Financials, Materials, and Consumer Discretionary sectors, posting total returns worse than -15%. These sectors were particularly vulnerable to rising tariffs, supply chain disruptions, and weakening global demand, which eroded corporate earnings and investor confidence. The heavy concentration in cyclical industries made the index especially susceptible to macroeconomic shocks, highlighting the indexes economic sensitivity to international trade tensions.
Following the resolution of the trade war and toward the end of the COVID-19 pandemic, the Industrials sector experienced a strong rebound, driven by a resurgence in manufacturing and increased overall production. Pent-up consumer demand, government stimulus, and a renewed focus on domestic supply chains contributed to the sector’s growth. Companies ramped up capital expenditures, infrastructure spending picked up, and labor market conditions gradually improved, all of which helped fuel industrial output. This post-pandemic recovery phase marked a pivotal shift, as firms sought to localize production and reduce dependency on global supply chains, further strengthening the performance of industrial equities. As a result, the Wisconsin Index saw a significant boost, benefiting from its heavy exposure to industrial and cyclical sectors (Figure 3).
Figure 3: Wisconsin Index Contribution to Returns (Post First Trade War 12/30/2022 – 12/29/2023)
![Contribution scatter plot by sector, 12/30/2022–12/29/2023. Industrials (circled in red) is the standout performer, with roughly +20% total return and ~16% contribution to return. Most other sectors cluster near the bottom left with low contributions. [Unassigned] has the highest total return (~140%) but a more modest contribution (~5%).](https://uwm.edu/business/wp-content/uploads/sites/554/2026/04/imcp-figure-3-wi-index-contribution-to-return.jpg)
Looking back at the first trade war, followed by the subsequent recovery and now facing a new round of trade tensions, one might reasonably expect the Industrials sector to be underperforming significantly. However, that hasn’t been the case so far. The Industrials sector is currently posting a total return of approximately -5%, a relatively modest decline compared to roughly -20% experienced during the first trade war. This is particularly notable given that the current trade conflict is far more intense, broader in scope, and involves a wider range of countries (see Figure 9).This resilience raises several important questions. Are investors less concerned this time around because the initial trade war did not lead to a full-blown recession? Is there a belief that companies have since adapted to protectionist policies by diversifying supply chains or reshoring operations? Or perhaps the full economic impact of the new tariffs has yet to be realized, and markets are still underestimating the long-term consequences. It’s also possible that current macroeconomic conditions, such as strong labor markets, steady domestic demand, and fiscal support, are temporarily cushioning the blow. Still, the situation remains fluid, and Industrials could face renewed pressure if global trade frictions escalate or if delayed effects of the policy shift begin to surface more broadly in corporate earnings and capital investment.
Figure 4: Wisconsin Index Contribution to Returns (Second Trade War 1/17/2025 – 5/14/2025)
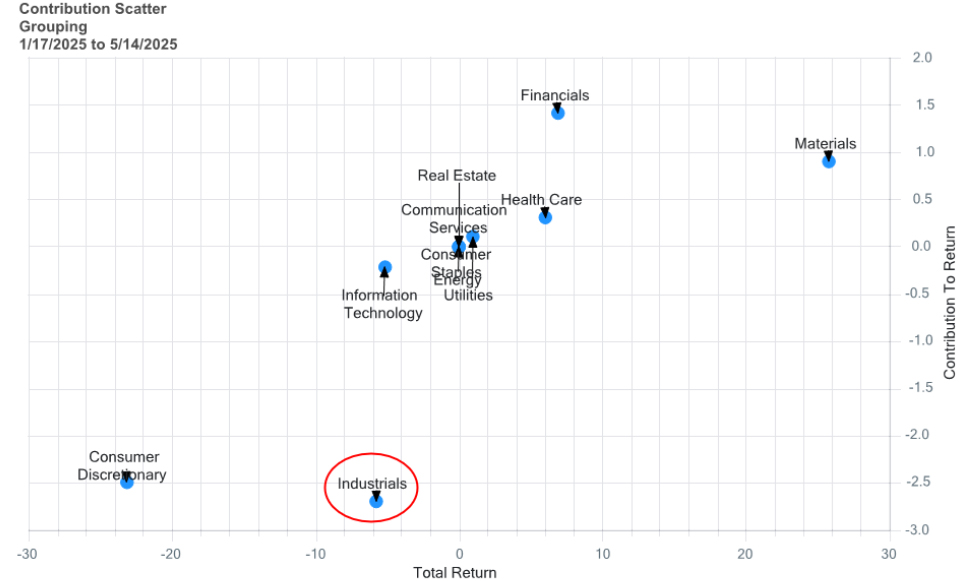
The Wisconsin Index’s journey through multiple economic cycles and trade conflicts reveals both its vulnerabilities and its capacity for resilience. Historically, its heavy exposure to Industrials and other cyclical sectors has left it susceptible to global trade disruptions, as seen during the first U.S.-China trade war. Yet the current environment, despite being defined by broader, more aggressive tariff measures, has not produced the same degree of underperformance. This change raises meaningful questions about whether companies and investors have become more adept at navigating protectionist policies, or whether the true economic fallout has simply been delayed.
While short-term fundamentals such as domestic demand, fiscal support, and strong labor markets appear to be cushioning the impact for now, the long-term trajectory of the Wisconsin Index will depend on how trade dynamics evolve, how companies adapt, and how global growth trends unfold. The current moment offers both risk and opportunity, and the coming year may serve as a critical test of the index’s structural strength and cyclical positioning.
Index Performance
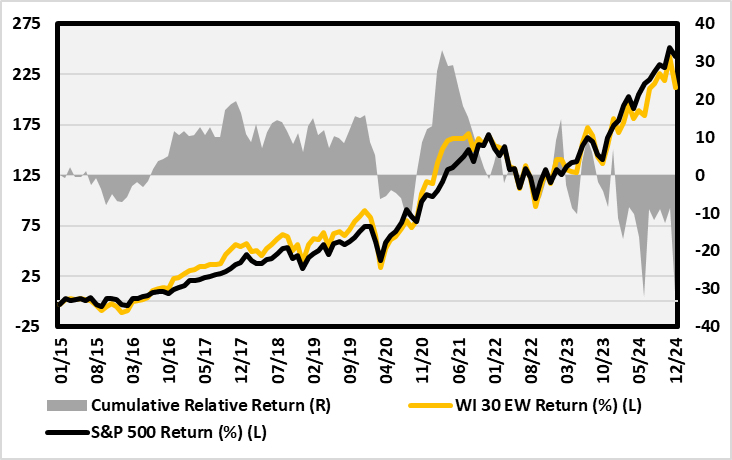
The Wisconsin 30 index under-performed the S&P 500 on a 1-, 2-, 3-, and 5-year basis, but outperformed over 10 years.
| Period | Wisconsin 30 | S&P 500 | Difference |
|---|---|---|---|
| 1-Year | 10.9% | 25.0% | -14.1% |
| 2-Year | 44.0% | 57.9% | -13.9% |
| 3-Year | 17.9% | 29.3% | -11.3% |
| 5-Year | 64.2% | 97.0% | -32.8% |
| 10-Year | 211.7% | 242.9% | -31.1% |
The Wisconsin 30 Index has outperformed the S&P 500 over the last 10 years, but it has underperformed more recently.
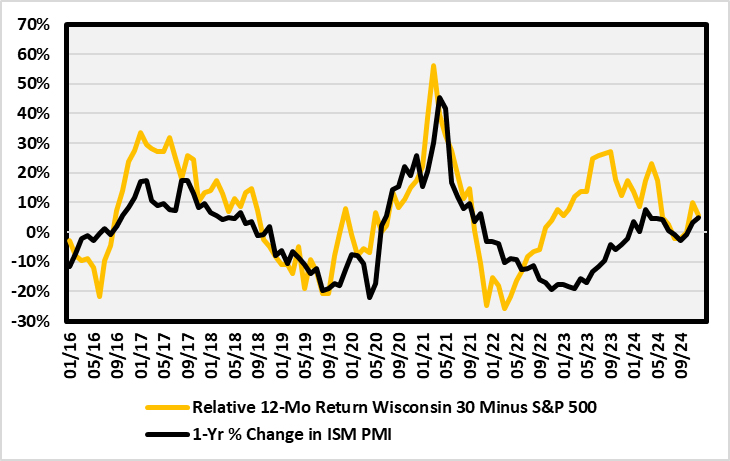
The equal-weight Wisconsin 30 Index has smaller and more economically sensitive companies than the S&P 500, so changes in the Institute for Supply Management’s PMI index have a large impact on returns. The PMI index is a survey of manufacturers on growth. The graph highlights the annual change in PMI (or acceleration of deceleration of growth) and returns of the Wisconsin 30 Index versus the S&P 500. As goes the economy, goes the Wisconsin 30 Index.
Top/Bottom Performers
Here are the best and worst performing Wisconsin 30 index stocks for the 12 months ending 12/31/24.
5 Highest Performers
| Ticker | Company | Return |
|---|---|---|
| MOD | Modine Manufacturing Company | 94.2% |
| FI | Fiserv, Inc. | 54.6% |
| PLXS | Plexus Corp. | 44.7% |
| BMI | Badger Meter, Inc. | 38.3% |
| EPAC | Enerpac Tool Group Corp. Class A | 32.3% |
5 Lowest Performers
| Ticker | Company | Return |
|---|---|---|
| LVWR | LiveWire Group, Inc. | -57.5% |
| KSS | Kohl’s Corporation | -45.9% |
| MRTN | Marten Transport, Ltd. | -24.6% |
| MAN | ManpowerGroup Inc. | -24.0% |
| EXAS | Exact Sciences Corporation | -24.0% |
Index Sector Weights
The Wisconsin 30 index is massively overweight industrials and massively underweight healthcare and technology.
| Sector 12/31/2024 | Wisconsin 30 | S&P 500 | Difference |
|---|---|---|---|
| Basic Materials | 3.3% | 1.3% | 2.1% |
| Consumer Discretionary | 6.7% | 15.2% | -8.5% |
| Consumer Staples | 3.3% | 4.1% | -0.8% |
| Energy | 0.0% | 3.2% | -3.2% |
| Financials | 16.7% | 10.5% | 6.1% |
| Health Care | 3.3% | 9.7% | -6.4% |
| Industrials | 50.0% | 11.6% | 38.4% |
| Real Estate | 0.0% | 2.1% | -2.1% |
| Technology | 3.3% | 37.3% | -34.0% |
| Telecommunications | 0.0% | 2.1% | -2.1% |
| Utilities | 10.0% | 2.6% | 7.4% |
| [Unassigned] | 3.3% | 0.2% | 3.1% |
Index Characteristics
The Wisconsin 30 Index has smaller companies than the S&P 500. They are less expensive than the overall market, but they have lower sales growth and profitability.
| Character | Wisconsin 30 | S&P 500 | Difference |
|---|---|---|---|
| Median Market Cap | 4,683 | 36,789 | -32,106 |
| Valuation | |||
| Dividend Yield | 2.16% | 1.26% | 0.91% |
| P/E* | 17.7 | 26.7 | -9.0 |
| P/CF* | 10.4 | 16.9 | -6.6 |
| P/B* | 2.0 | 4.8 | -2.8 |
| P/S* | 0.9 | 3.1 | -2.1 |
| Growth | |||
| 3-yr Sales | 6.9% | 13.9% | -7.0% |
| 3-yr Eps | 6.4% | 18.0% | -11.6% |
| Expected EPS 3-5 year | 4.9% | 14.3% | -9.4% |
| Profitablility | |||
| ROA | 6.9% | 17.1% | -10.2% |
| ROE | 14.4% | 25.7% | -11.3% |
| Net Margin | 11.2% | 21.1% | -9.9% |
| LT Debt/Capital | 27.4% | 38.4% | -10.9% |
Date: 12/31/24