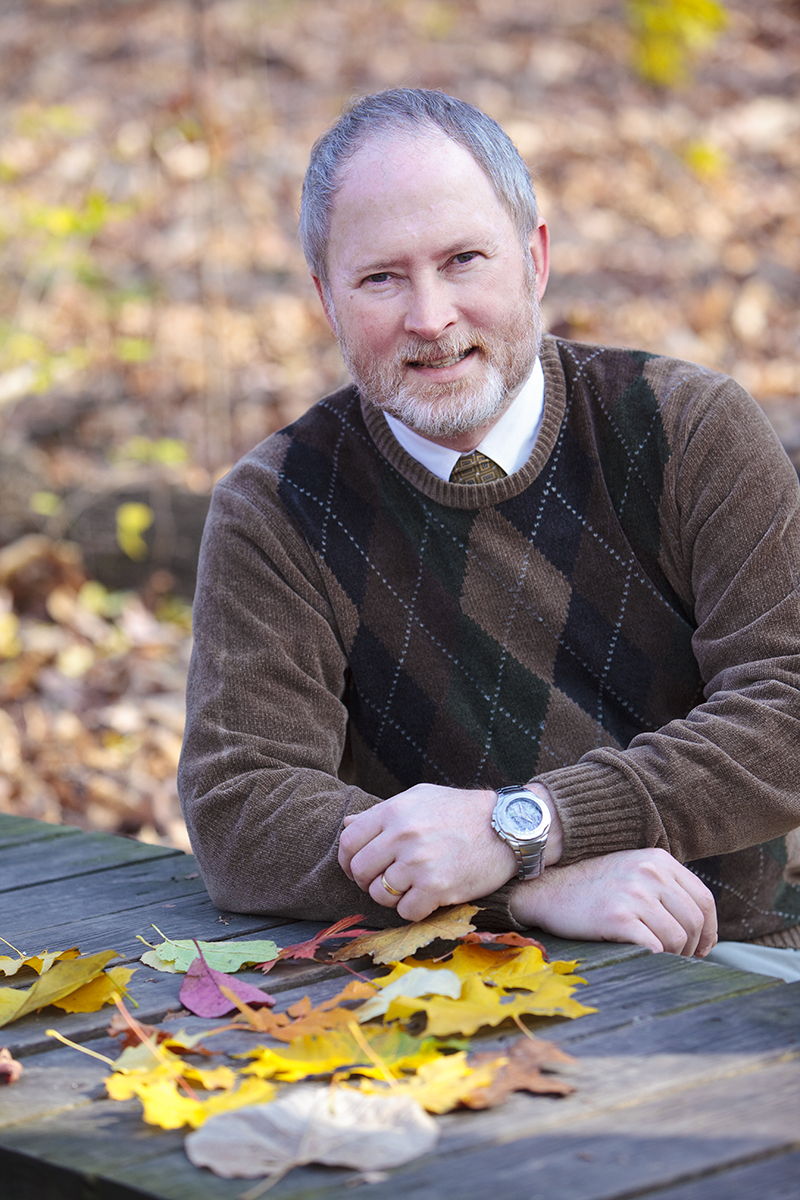
Faculty Spotlight: Mark Schwartz
New online tracker allows you to watch spring start
Mark D. Schwartz, a distinguished professor of geography, developed the spring indices, which measure relationships between temperature and plant growth.
Here, he explains vegetation phenology, his indices and how the science can be used in fields such as agriculture, wildfire prevention and gardening.
What is vegetation phenology?
Vegetation phenology is looking at changes in plants, particularly in seasonal climates like where we live, and where the plants go from being dormant to starting to grow in the springtime. When we are looking at trees, we are looking at when the leaves come out, and when we are looking at herbs and shrubs, we are looking at flowering.

UWM geographer Mark Schwartz has developed a way to track the budding of plants as spring spreads across the nation. His work helps farmers, gardeners and others, and gives insight on climate change.
How did you become interested in this field?
I’m a climatologist by training so I’m interested in seasonal weather patterns. I first got involved by building a model using weather data to understand these changes in plants. I have since learned that these changes are very useful in trying to understand a lot of other things that go on in the environment. When plants become active, they pump out water vapor into the atmosphere, and it changes the lower atmosphere and its composition, and that affects a lot of things.
I am also inclined to be interested in this area as someone who grew up in this part of the country. As a kid growing up in Michigan, I thought about the return of asparagus and rhubarb and mushroom hunting in the springtime. All of those activities relate to natural events and the return of plant growth.
What are the spring indices that you have developed?
They are models that use a fairly straightforward approach. A lot of the changes in plant growth in parts of the country where moisture isn’t a limiting factor are controlled by temperature. The models use some different processes to better track the subtleties of the relationship.
In the past, models were often developed to make them really good for a very small area. When I put these models together, I was trying to create models that would be applicable over large areas such as the entire lower 48 United States. The neat thing was that even though it was developed from particular plants, it has applicability for a wide number of plants.
When does spring start?
To me, real spring is when the plants begin to grow. In the models that I developed, I have two different events that are simulated. The first is the first leaf, which is the first bud opening and the leaf coming out from the bud. I think of this as early spring. Then around a month later, say mid-May, we get to the point where the lilac has at least one open flower on half of the flower clusters. I refer to that as late spring.
Why is it important to know when spring starts?
Anyone involved in agriculture is interested in when the growing season is starting. When farmers decide what crops to grow, they base that, to some degree, on making sure that when they put a particular crop into the ground, it will be able to be brought successfully to harvest. They don’t make those decisions at the last minute. The decision to plant a particular kind of crop in a particular area is based on the long-term climatology.
From a natural resources standpoint, particularly in the western part of the country, it can make a difference in things like fire danger. In places where moisture is limited, like in the western states, if the growing season starts earlier, it means plants start to pump water out of the ground and deplete the soil moisture earlier. It doesn’t directly cause wildfires, but if the season starts earlier, that could lead to more potential for wildfire in the western United States, due to drier conditions.
How does phenology help the public understand climate change?
Phenology gives another independent measure of what is happening. When I talk to people about change, I can say, for example, that over the Northern hemisphere from the mid-1950s to the early 2000s, the timing of the beginning of spring using my models has gotten earlier by about a week. It’s a very easy thing to explain. It’s something that most people can readily understand.
Can anyone make the same general observations?
You don’t need special instruments. You can go out and watch the plants yourself and decide if these things are happening or not. Having these gridded spring indices up on the USA National Phenology Network site gives people a tool so they can not only see what’s happening in their backyard, but see what’s happening in other parts of the country.
Watch spring start here: https://www.usanpn.org/data/spring.