Has misinformation about COVID-19 circulating on social media affected the spread of the disease? A group of UWM geographers has tested the question scientifically by painstakingly examining nationwide Twitter chatter and then showing the results on a national map, revealing who was sharing what early in the pandemic.
The researchers found a direct correlation between locations where Twitter misinformation originated and subsequent spikes in COVID-19 infections and deaths in those areas weeks later.
“The social media impact on the pandemic happened very quickly,” said Rina Ghose, professor of geography, who led the study of social media activity from May to July of 2020. “We wanted to examine it in this specific time period to see what happened when the pandemic first went ‘kaboom!’”
Their findings highlight the importance of social media monitoring during a pandemic so that health officials can be alerted to problem areas.
The researchers pinpointed specific locations where the association was most pronounced by integrating statistical methods with computerized mapping, a technique called geographic information systems, or GIS.
GIS is used to see all the place-based data together on the same map, revealing spatial relationships and patterns.
Tweets are geotagged, meaning their locations of origin are identified, but not the identity of individual people using Twitter. With locations known, Ghose said, she and her students could connect the content of the tweets with the information about those areas in public databases, such as census tract demographics and health statistics from the Centers for Disease Control and Prevention.
“With GIS, we don’t just layer the data on maps, we can integrate it so that all the data is connected and can speak to each other,” Ghose said. “We can ask many types of questions and examine ‘what-if’ scenarios.”
Dissecting the tweets
The project was hatched when doctoral student Amir Forati and master’s student Rachel Hansen wondered why the pandemic was unfolding the way it was. They wanted to engineer a study that would explain both the reasons for and effects of public resistance to measures to limit the spread of COVID-19.
They began by collected all pandemic-related tweets nationwide for May and June and identified the ones that either contained false information or downplayed the severity of COVID-19, Forati said.
Using statistical methods, Forati then confirmed that locations with heavy Twitter misinformation in May and June later experienced a rise in the number of cases in July.
The sharing of misinformation and negative tweets occurred throughout the country. But demographic data from the geotagged tweets indicated some common traits, he found.
“They were areas that were predominantly white, middle-age, middle-income, politically conservative, and with low educational attainment beyond high school,” he said.
But one surprise, he said, was how widespread sharing misinformation was outside of those trends.
“We saw it even in big cities, where there are greater numbers of educated people,” Forati said. “So, you can’t just say it was the rural areas that were the base of the problem.”
To knit all the information together, the researchers used a multi-platform approach, blending the various datasets – content on Twitter and public demographic and health data – and using it in a statistical modeling method that’s sensitive to data on multiple scales – national, state and local.
Their analysis explains about 85% of the COVID spikes across the U.S. in this time period, he said.
Many categories
Ghose and Hansen then turned their attention to categorizing the tweets. GIS allowed the researchers to see what categories were dominant in particular regions of the country.
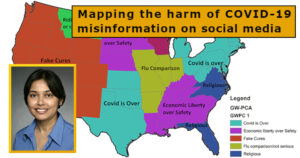
They analyzed nearly 1,000 individual tweets and their accompanying photos and conversations, and put them into four categories: political agenda, health myths, religion myths and freedom rhetoric.
The tweets were then subdivided to represent seven themes that were spatially modeled. In Wisconsin, they found that “individual liberty over safety” was the dominant theme of tweets during this time period and it was the only area of the country where that was true.
“We saw different discourses of false information when comparing the West Coast and East Coast – even in similar demographic areas,” Ghose said. “So, the goal behind the categorization was to identify what the motivations were.”
The next step in their research will be adding information from a social vulnerability index to the mapping of false tweets. The index, from the CDC, shows the locations of people who are more vulnerable to illness by several vectors, Hansen said, not just health factors. The index logs socio-demographic factors in addition to factors such as access to health care and health insurance.
“Maps showing that data will show where vulnerable populations also defined by socioeconomic factors, like income, are in the context of the areas with heavy misinformation,” Hansen said.
By Laura Otto, University Relations