Milwaukee is a city of opportunity – if you live in the right neighborhood. The proof is mapped out in blue and white.
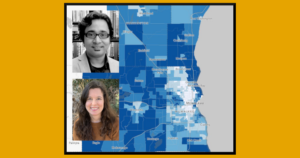
This map (accessible at https://bit.ly/3xs9hI6) was made as part of the Mapping Opportunity for the Milwaukee Metro Area project. Created by UWM Center for Economic Development graduate fellows Tathagato Chakraborty and Yotala Oszkay as a collaborative project, the interactive guide is a visual representation of opportunity available to residents in each U.S. Census tract listed in Milwaukee and its surrounding suburbs. The map expands to the four-county Milwaukee Metropolitan region including Ozaukee, Washington, Waukesha and Milwaukee counties.
To Chakraborty, working toward his PhD in urban studies at UWM, and Oszkay, a PhD student in sociology at UCLA, opportunity is complex and multidimensional. In this case, Chakraborty said, opportunity means that there are avenues for a person’s socioeconomic upward mobility – that they have ways to foster growth and wellbeing.
“So, where you are living really affects your ability to be upwardly mobile. The spatial dimension is a really important aspect of opportunity,” Oszkay said.
The map shows all 478 census tracts in the Milwaukee metro region. For each tract, Chakraborty and Oszkay poured over thousands of pieces of census and other data sources to pull out three main dimensions that, together, determine a neighborhood’s “opportunity index.” They are:
1. Economic Dimension
The main indicators determining a tract’s economic health included median household income, level of employment, number of people with high-paying jobs, and income level.
Measuring economic indicators to determine economic opportunity is an obvious move, but those indicators also hint at other avenues – or barriers – to success.
“Economic disadvantages create a number of rippling effects to neighborhoods, especially in accessing quality services and resources that may hinder a person’s wellbeing. So if you are not in a desirable neighborhood, you may face certain barriers,” Chakraborty noted.
2. Education Dimension
Here, the researchers looked at the highest level of education that people had obtained and what percentages of households had internet access.
As one might expect, “Education is an essential tool for you to get to jobs, especially get a job that pays enough (to enable economic mobility),” Chakraborty said.
3. Housing Dimension
The main indicators here included median home value, what percentage of people in the area owned homes, and what percentage of households are costburdened (that pay more than 30% of their income into their mortgage or rent).
Housing is an important indicator, Chakraborty explained, because “housing is an asset which moves intergenerationally. If you have a well-valued housing situation, over time the equity increases. So, over a period of time, you actually accumulate wealth that may be passed on to the future generation or used to invest futuristically.”
They classify five types of neighborhoods with varying level of opportunity. Areas with higher opportunity index values are marked in dark blue on the map; lower index values are marked in light blues and whites. Chakraborty and Oszkay ranked each tract for easy comparison between neighborhoods. They want the map to be easily read by everyone, not just academics.
The map also includes each area’s demographic information. However, the researchers stressed, that the index was designed to be race-neutral when they determined the dimensions of opportunity. The map strictly shows the opportunity index for each area, but does not speculate why a particular area might have a low index.
But Milwaukee is among the most racially segregated cities in the United States, and areas of high opportunity and low opportunity seem to fall along racial lines. Oszkay, who grew up in Milwaukee, was not surprised.
“It confirmed what I qualitatively understood. That gave me confidence, actually, for what we were doing – seeing how the data really shows what I experienced as a resident,” she said. “You can see how I-43 divided two areas, where there’s affluence (on one side) and lack of opportunity (on the other).”
Chakraborty went a step further.
“As an experiment, I did overlay the redlining map and the famous segregation map on our index (this image was not published as part of the project). The geographic symmetry of those areas that are redlined, that are segregated, and that are showing in our index as nice or very low opportunity areas coincide perfectly!” he said. “It confirms the historical trajectory of why we are here and how we are here.”
The extremely detailed work builds off some of the research performed by UWM associate professor of sociology Marcus Britton, who studies how location impacts social and economic outcomes, and by associate professor of geography Anne Bonds and English assistant professor Derek Handley, who are currently mapping the modern impacts of historical racial housing restrictions in Milwaukee.
Chakraborty and Oszkay hope that their map will help viewers understand the full scope of opportunity and inequality in Milwaukee in racial-spatial terms, although it does not include any race-specific indicator. And if they understand it, the researchers said, perhaps leaders can work to change it.
“Policy makers could very easily take a glance at this map and see where investment needs to go and which areas need reparations,” Chakraborty noted. Oszkay added, “Where you live is going to shape who you are and what you become. I think that’s an important perspective for a broader audience to consider when understanding their lived experiences.”
The Mapping Opportunity for the Milwaukee Metro Area project is finished, and both Chakraborty and Oszkay are taking a pause on research to finish up their PhD work – Chakraborty here at UWM, and Oszkay in sociology at UCLA. They both thanked the researchers at the UWM Center for Economic Development – Joel Rast, Yaidi Cancel Martinez, and Lisa Williams – as well as UWM’s American Geographical Society librarian Stephen Appel, for their support and help in completing the work.
By Sarah Vickery, College of Letters & Science