Prepared by:
Tathagato Chakraborty and Yotala Oszkay
Graduate Research Fellows at the Center for Economic Development
Content
Opportunity: Meaning and Mapping
Spatial variation in access to resources, institutions, and services directly impacts life chances. While geographies of opportunity create advantages for residents of stable and privileged areas, areas where opportunity is lacking are more likely to do the opposite, fostering concentrated disadvantage and a lack of upward social mobility among residents.
The Mapping Opportunity project explores the spatial variation in opportunity across the Milwaukee -Waukesha-West Allis Metropolitan Statistical Area (Milwaukee Metro Area). Neighborhoods (represented as census tracts) are ranked on three Opportunity Dimensions, Economy, Education, and Housing, using several socioeconomic indicators. By creating a composite measure based on these indicators—called the Opportunity Index—we measure the overall level of opportunity for each of the 428 census tracts in the four-county Milwaukee region.
Mapping Opportunity is a novel attempt to measure the spatial distribution of opportunity to better understand how spatiality shapes and influences neighborhoods and the people who reside there. We hope this project will be a useful tool for public officials, community organizations, academics, students, and others interested in the geography of opportunity in the Milwaukee Metro Area.
Navigating and Reading the Map
The Opportunity Index map is showcased as a web application using the ESRI ArcGIS Online platform. The map is color-coded: darker shades indicate higher levels of opportunity and vice-versa. The 428 census tracts in the region are divided into 5 intervals, from high to low, based on their ranks in the Opportunity Index. Each interval represents 20% of the total census tracts ranging from lowest (Rank 428) to highest (Rank 1) opportunity (see table below). By clicking on a census tract of interest, you can see more detailed information on the indicators used to construct the Index. Additional information, not used in calculating the rank of census tracts, is also provided about the racial and ethnic composition of each tract.
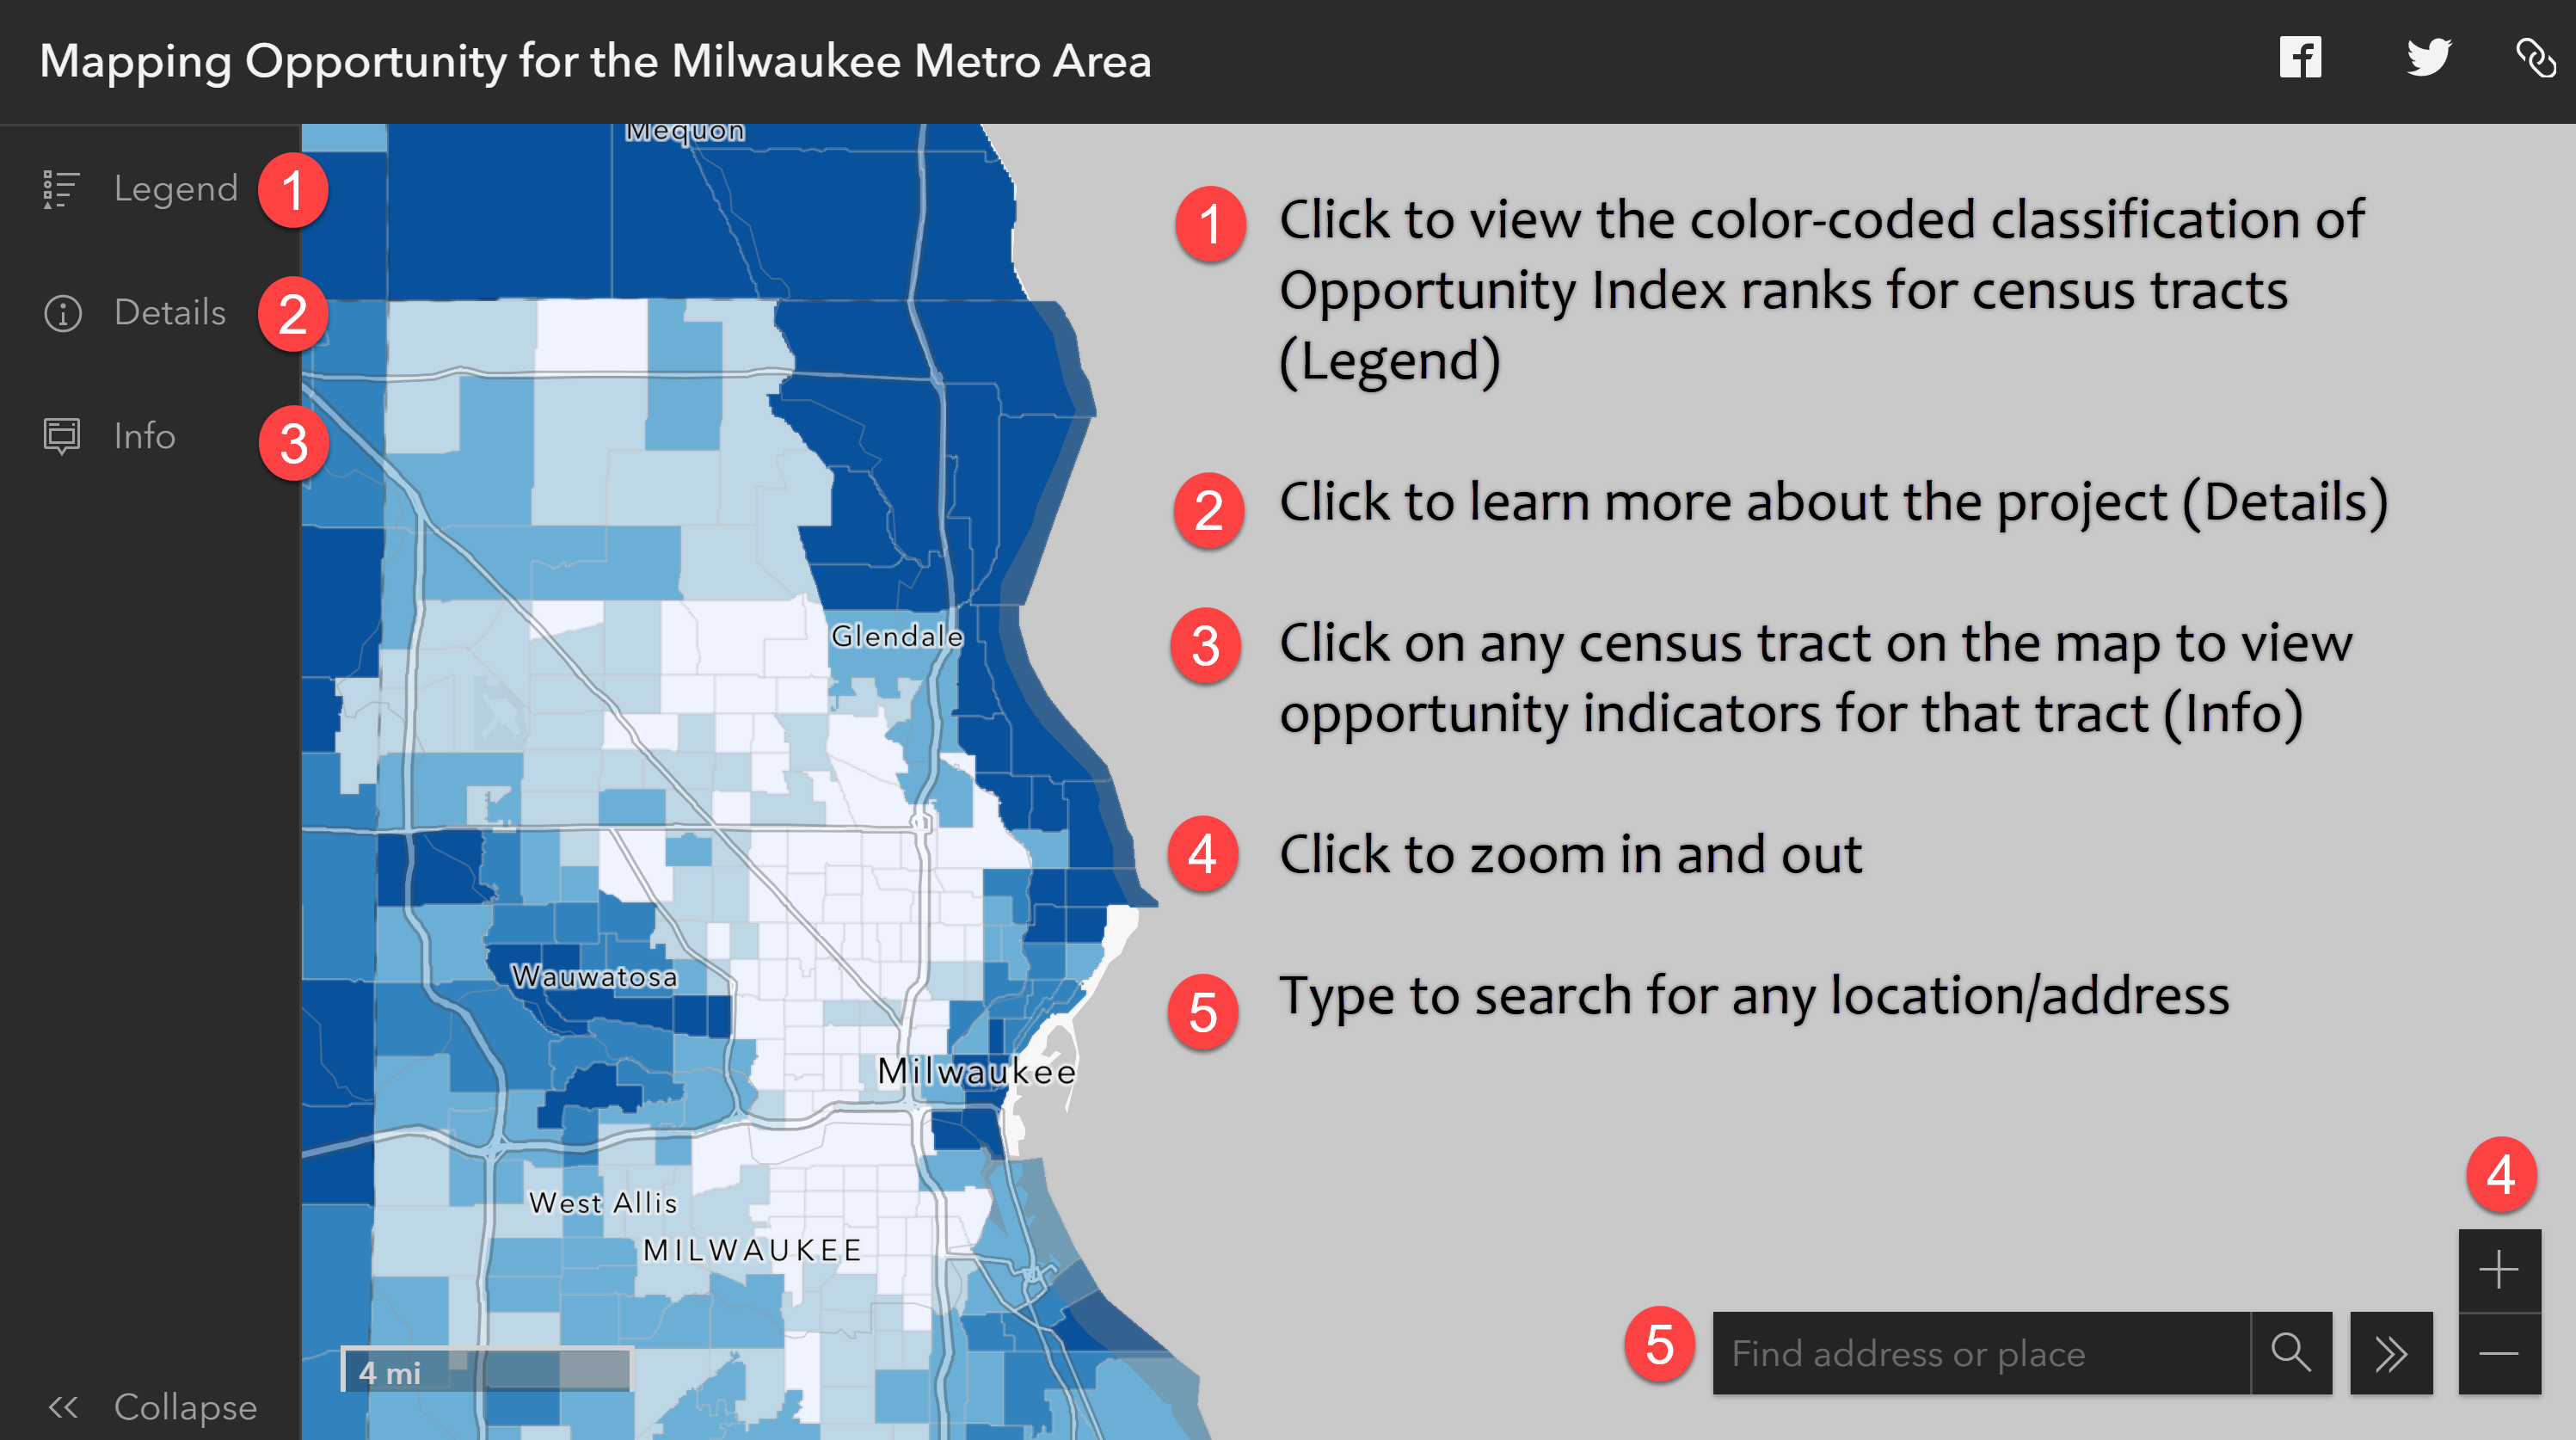
Table: Group Classification, Rank, and associated Opportunity Categories
| Opportunity Categories | Group Classification | Rank | Number of Census Tracts |
|---|---|---|---|
| Very High Opportunity | 0-20% | 1-86 | 86 |
| High Opportunity | 20.1%-40% | 87-172 | 86 |
| Moderate Opportunity | 40.1%-60% | 173-258 | 86 |
| Low Opportunity | 60.1%-80% | 259-343 | 85 |
| Very Low Opportunity | 80.1% - 100% | 344- 428 | 85 |
For details about the data and methodology, please click here.
We express our sincere thanks to Prof. Joel Rast, Lisa Williams, and Dr. Yaidi Cancel Martinez at the Center for Economic Development for their valuable comments and suggestions and support. We also express our sincere thanks to Stephen Appel, Geospatial Information Librarian at the American Geographical Society Library, University of Wisconsin-Milwaukee, for his guidance on the geovisualization process.
Tathagato Chakraborty is a PhD candidate (Urban Studies) and a Graduate Research Fellow at the Center for Economic Development, University of Wisconsin-Milwaukee.
Yotala Oszkay is a PhD candidate (Sociology) at the University of California, Los Angeles and a Graduate Research Fellow at the Center for Economic Development, University of Wisconsin-Milwaukee.
Please direct all comments and questions to info-ced@uwm.edu