Brief Description (Alt Text):
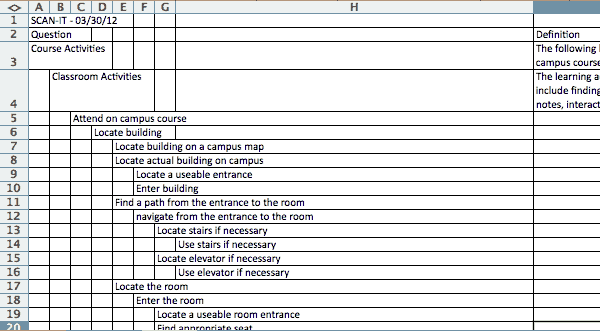
Screenshot of a table showing SCAN-IT TaxonomyEssential Description (Caption):
Screenshot of the SCAN-IT taxonomy showing elements associated with the principle category of Classroom Activities. The SCAN-IT taxonomy guides a user through evaluation of campus accessibility from a student’s perspective.
Detailed Description (Description):
Screenshot of an excel table. The y axis is labeled one through twenty, and the x axis is labeled A through H. This chart lists steps to locate a campus building and navigate through campus to attend said campus course through through the SCAN-IT software, and there is one step per line. Black text on a white background.