Brief Description (Alt Text):
Screenshot of a table showing RATE-IT TaxonomyEssential Description (Caption):
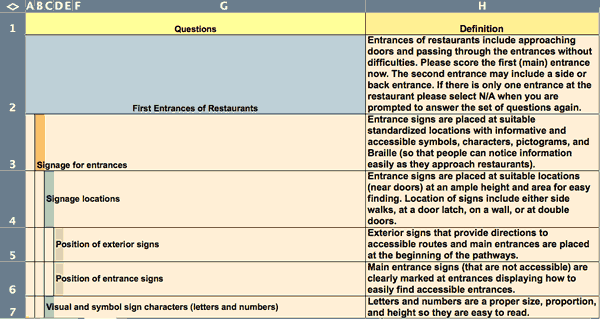
Screenshot of the RATE-IT taxonomy showing elements related to the parent area of measurement “entrance of restaurants”. The RATE-IT taxonomy guides a user through assessment of functional occupation components for people with disabilities dining at restaurants.
Detailed Description (Description):
Screenshot of Excel table that outlines a restaurant's interior and exterior design regarding signage and position of doorways. The y axis has 7 numbers, and the X axis has two categories: Questions on the left and Definitions on the right which are labeled in yellow boxes. The question in Row 2 has a blue background, and all of the rest of the boxes have a cream colored background.