Brief Description (Alt Text):
Flowchart demonstrating the 3 phases of Project OATSEssential Description (Caption):
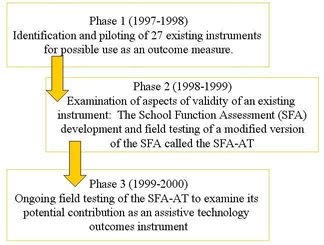
This diagram represents the three phases of Project OATS research in the years between 1997 and 2000. This includes a short description on Phase 1 (1997-1998), Phase 2 (1998-1999), and Phase 3 (1999-2000).
Detailed Description (Description):
This diagram is on a white background with 3 long rectangular text boxes outlined in yellow. The top text box includes information on Phase 1(1997-1998) of Project OATS in black text stating “Identification and piloting of 27 existing instruments for possible use as an outcome measure”, and there is a bold yellow arrow on the left side pointing downwards to the middle text box below, which is indented towards the center of the screen. The middle text box includes information on Phase 2 (1998-1999) of Project OATS in black text stating “Examination of aspects of validity of an existing instrument: The School Function Assessment (SFA) development and field testing of a modified version of the SFA called the SFA-AT”, and also has a bold yellow arrow pointing downwards to the bottom and final text box. The bottom text box is shifted back to the left to be in line with the top text box and includes information on Phase 3 (1999-2000) of Project OATS in black text stating “Ongoing field testing of the SFA-AT to examine its potential contribution as an assistive technology outcomes instrument”.