Brief Description (Alt Text):
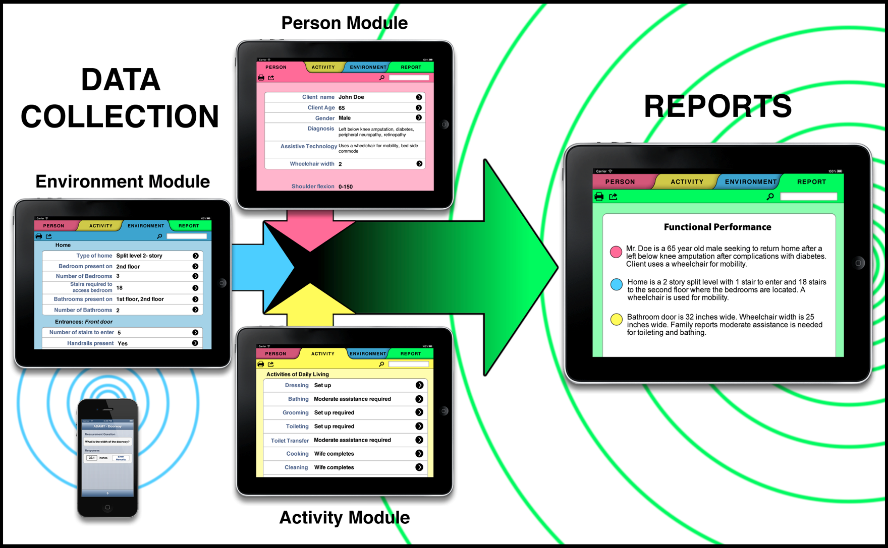
Data Collection diagram depicting 3 iPads, one with the Person Module, one with the Environment Module, and the third with the Occupation or Activity Module, integrating their data into a summary report on the client's functional performance.Essential Description (Caption):
This image shows a data collection diagram with information from each module of the HESTIA home evaluation app. There are 3 ipads, one with the Person Module, one with the Environment Module, and one with the Activity Module with arrows pointing to an ipad with the Reports Module. This intends to show that the data collected in the HESTIA app can be integrated into a summary report of the client’s functional performance.
Detailed Description (Description):
Graphic moves from left to right with an iPad in the middle of the screen on the left with HESTIA pulled up on the screen. Below there is an iPhone and above there is the label of "Data Collection" and "Environment Module". Moving to the left there are two iPads, the top and bottom both have HESTIA pulled up onto the screen but on different pages. The top is labeled "person module" and There is a big green arrow pointed to the final iPad screen on the right labeled "reports" with a HESTIA tab pulled up.