Full resolution (531 × 377)
Brief Description (Alt Text):
Screenshot of OT FACT graphs screenEssential Description (Caption):
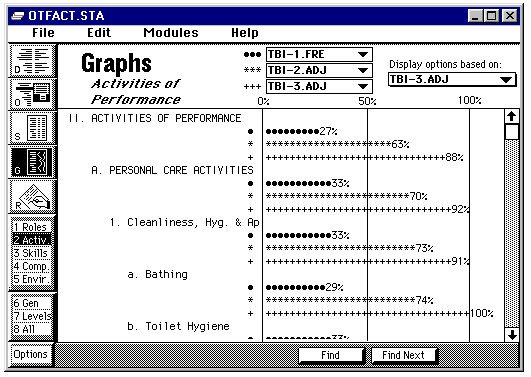
The purpose of this screenshot is to show what the ‘Graphs Module’ screen looks like when using OT FACT software. The screen is displaying ‘Activities of Performance’ categories being scored with their corresponding bar graph and percentage.
Detailed Description (Description):
Screenshot depicting the OT FACT Graphs Screen. At the top of the screen is royal blue border with the text “OTFACT.STA” on the left and three menu options to the right (minimize, maximize, and close). Below the blue border is a white menu bar with black text reading from left to right “File”, “Edit”, “Modules”, and “Help”. Below the menu bar on the left side of the screen is a vertical column of selectable options. The first five options are small square boxes with a letter and a visual depiction to indicate the option. Of these options, the box with a “G” is selected with a black highlight. Below the boxes are nine small rectangles with the following options: “1 Roles”, “2 Activ”, “3 Skills”, “4 Comp”, “5 Envir”, “6 Gen”, “7 Levels”, “8 All”, and “Options”. “2 Activ” is selected with a black highlight. In the middle of the screen is large, bold, black text that reads “Graphs” with “Activities of Performance” italicized and written in a smaller font below it. To the right are three drop down menus with the top displaying “TBI-1.FRE”, the middle displaying “TBI-2.ADJ”, and the bottom displaying “TBI-3.ADJ”. To the right of these drop down menus is text reading “Display options based on:” and another drop down menu displaying “TBI-3.ADJ”. Taking up the majority of the screen is the graphical display. The graph shows scoring for “Activities of Performance” and its subcategories on a percentage scale from 0%-100%. The categories represented are “Personal Care Activities” with the subsection of “Cleanliness, Hyg. & Ap” and further branching to “Bathing” and “Toilet Hygiene”. At the bottom of the screen is a grey menu bar with buttons reading “Find” and “Find Next” on the right.