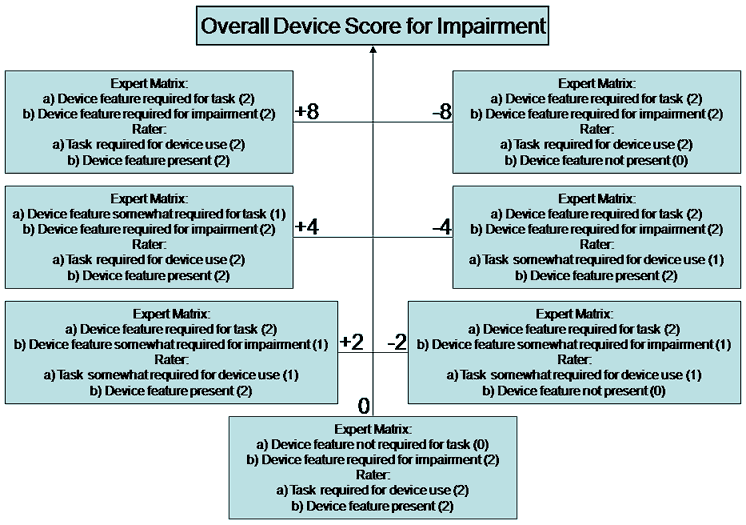
Brief Description (Alt Text):
Flowchart showing the scoring algorithm used in MED-AUDITEssential Description (Caption):
This image shows a light blue flowchart that represents the MED-AUDIT scoring algorithim. The algorithim uses a sums of product relationship with 4 product terms which aid in determining the accessibility and usability of the medical equipment being evaluated.
Detailed Description (Description):
This graphich displays a flowchart with 8 Blue boxes with black text. There is one box at the top, one at the bottom, and two colums of 3 boxes in the middle. All of these boxes are connected by 3 horizontal lines and one intersecting vertical arrow facing up. The top box contains the label "Overall Device Score for Impairment". The rest of the 7 boxes contain different Ratings divided bt Expert Matrix and Rater with two options under each. To the right of the 3 boxes on the left, there is a +8, +4, and +2 respetively. To the left of the three boxes on the right there is a -8, -4, and -2 respectively. The box at the bottom has a zero just above it to the left of the ascending arrow.