Brief Description (Alt Text):
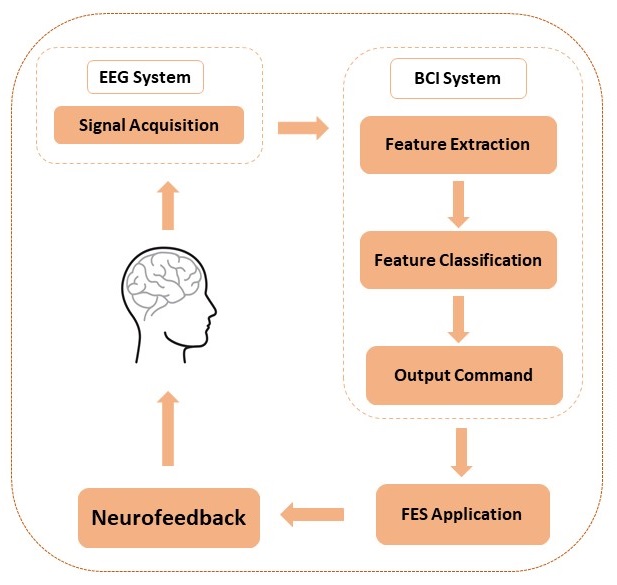
A graphic showing the flow of data between the user and a brain-computer interface that controls a Functional Electrical Stimulation unit connected to the userEssential Description (Caption):
Cyclical flow diagram showing an oerview of the BCI-FES system. In this system, a signal is acquired by the EEG system and is then used by the BCI system for feature extraction, feature classification, and production of an output command. This command goes to the FES application in order to provide neurofeedback and restart the cycle. The diagram primarily serves to illustrate the process of using BCI technology to control the FES application through detection of neural activity.
Detailed Description (Description):
On a white background is an image with a light orange dotted border with curved edges outlining the whole image. The image consists of various dotted borders, rectangles, and arrows all in a light orange. The titles are in a black font. Starting at the top left corner and going clockwise: there is a dotted line rectangle with two rectangles inside. To the right is an arrow pointing to the right at another dotted line rectangle. The rectangle contains 4 rectangles inside with two arrows pointing downwards between the 2nd box and below the 3rd box. Underneath the dotted line is another arrow pointing downward at an orange rectangle. To the left of this is an arrow pointing left at a rectangle. Above the rectangle is an arrow pointing up at an outline in orange of a profile and a brain inside of the head. Above this is an arrow pointing up to the starting rectangle.