Analytical instruments and Research in Guo’s Lab
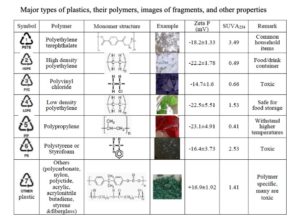
A. Instruments for colloidal and nanoparticle characterization
• Asymmetrical Flow Field-Flow Fractionation (AFlFFF) system
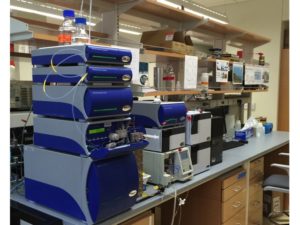
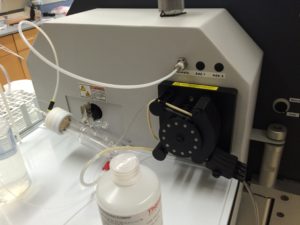
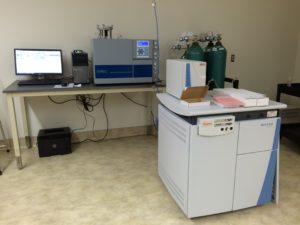
The flow field-flow fractionation (FlFFF) is a chromatography-like technique capable of simultaneous separation and characterization of colloids, nanoparticles and macromolecules in aquatic environments. Our new asymmetrical flow field-flow fractionation system (Postnova) purchased through a NSF Major Research Instrument grant (NSF-MRI award #1233192) can be coupled with a series of online detectors including a multiple angles light scattering (MALS) detector (21 angles), a UV absorbance detector, two fluorescence detectors with four different Ex/Em wavelength combinations, a refractive index, ICP-MS (e.g., Stolpe et al., 2010; Stolpe et al., 2013; Zhou et al. 2016), and other offline detectors/instruments, such as spectrophotometer, 3D fluorometer (e.g., Zhou and Guo, JCA 2015), EEM-PARAFAC (e.g., Lin and Guo, 2020 ES&T; Lin et al., 2021, L&O), gamma- & alpha-spectroscopy, and SEM/TEM/AFM, supporting and augmenting graduate education and ongoing research and allowing broader applications in aquatic and environmental sciences and other emerging topics.
Contact Dr. Guo at guol@uwm.edu for more information.
 |
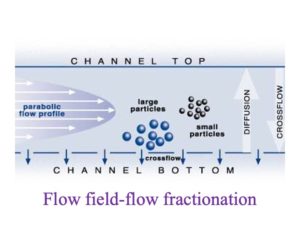 |
| Postnova asymmetric flow field-flow fractionation system, coupled online with detectors including UV-absorbance, fluorescence with 4 different Ex/Em combinations, refractive Index, Multi Angle Light Scattering (MALS), and others. | How different sized-colloidal particles are separated using flow field-flow fractionation (from Postnova) |
 |
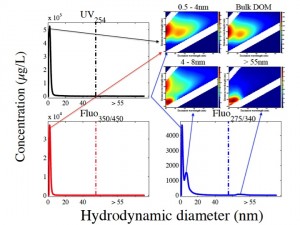 |
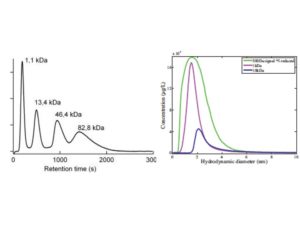
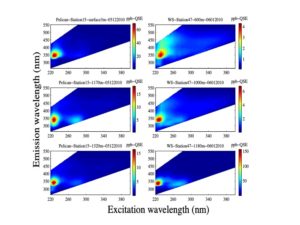
| Separation of standard macromolecules using the FlFFF system (from Stolpe et al.) and changes in CDOM absorbance with membrane NMW cutoff (Zhou and Guo, Journal of Chromatography A) | Examples showing the coupling between FlFFF separation techniques and fluorescence EEMs measurements. As shown in the EEM spectra, bulk DOM is highly heterogeneous with different chemical composition between DOM size fractions (from Zhou and Guo, 2015, Journal of Chromatography A). |
 |
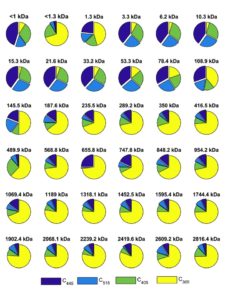 |
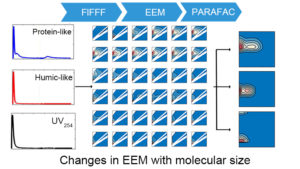
| Coupling the FlFFF size-fractionation with EEM-PARAFAC analysis to elucidate PARAFAC-derived DOM components in individual water samples and to decipher changes in DOM composition and optical properties with molecular weight between samples across the river-lake and land-ocean interfaces (from Lin and Guo, 2020, ES&T). | Examples showing the dynamic changes in PARAFAC-derived fluorescent DOM components with molecular weight within an individual DOM sample from the Milwaukee River (from Lin and Guo, 2020, ES&T). |
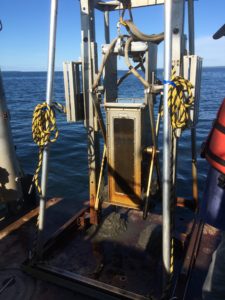
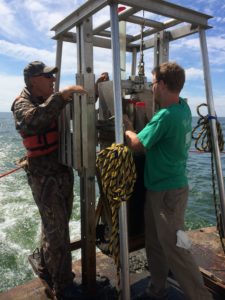
• SPLITT system: for size fractionation/separation of suspended particles and/or sediment/soil for further chemical and isotopic characterization
• Ultrafiltration systems
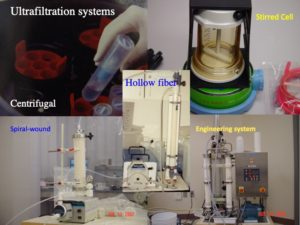
Our ultrafiltration systems have been widely used for size fractionation and isolating colloids or high molecular weight DOM for further chemical and isotopic characterization (Guo and Santschi, 2007, pdf; and Guo et al 2000). These ultrafiltration units range from large engineering systems equipped with multiple spiral-wound or hollow-fiber cartridges capable of processing hundreds and thousands of liters of water (Guo et al. 1996, 1997; Cai et al., 2015) to very small devices, such as centrifugal units and stirred cell units, for tracer studies and controlled laboratory experiments (e.g., Lin et al. 2015; Yang et al. 2015) and to quantify molecular size distributions of DOM and colloidal size spectra (e.g., Chen et al., 2004; Xu and Guo, 2017; Xu and Guo, 2018; Yang et al., 2021).
 |
 |
| Different ultrafiltration systems, ranging from centrifugal to stirred cells, large volume spiral wound cartridges and engineering systems | A schematic diagram showing components of ultrafiltration systems for isolating colloids/naoparticles from natural waters (Guo and Santschi 2007). |
 |
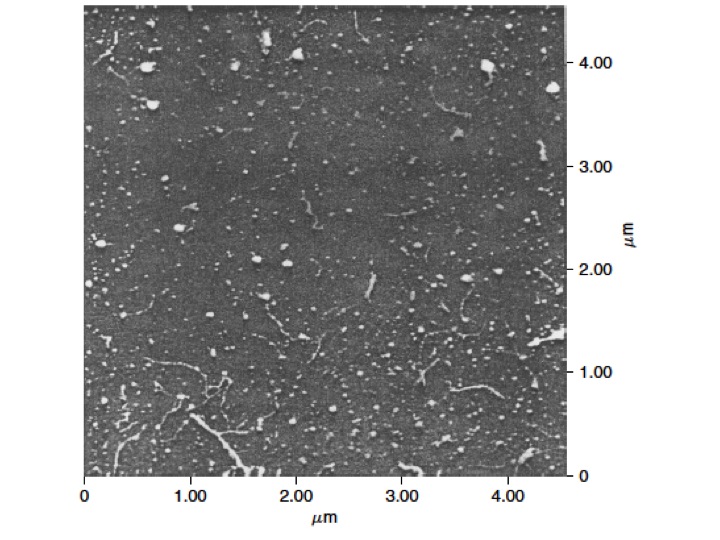 |
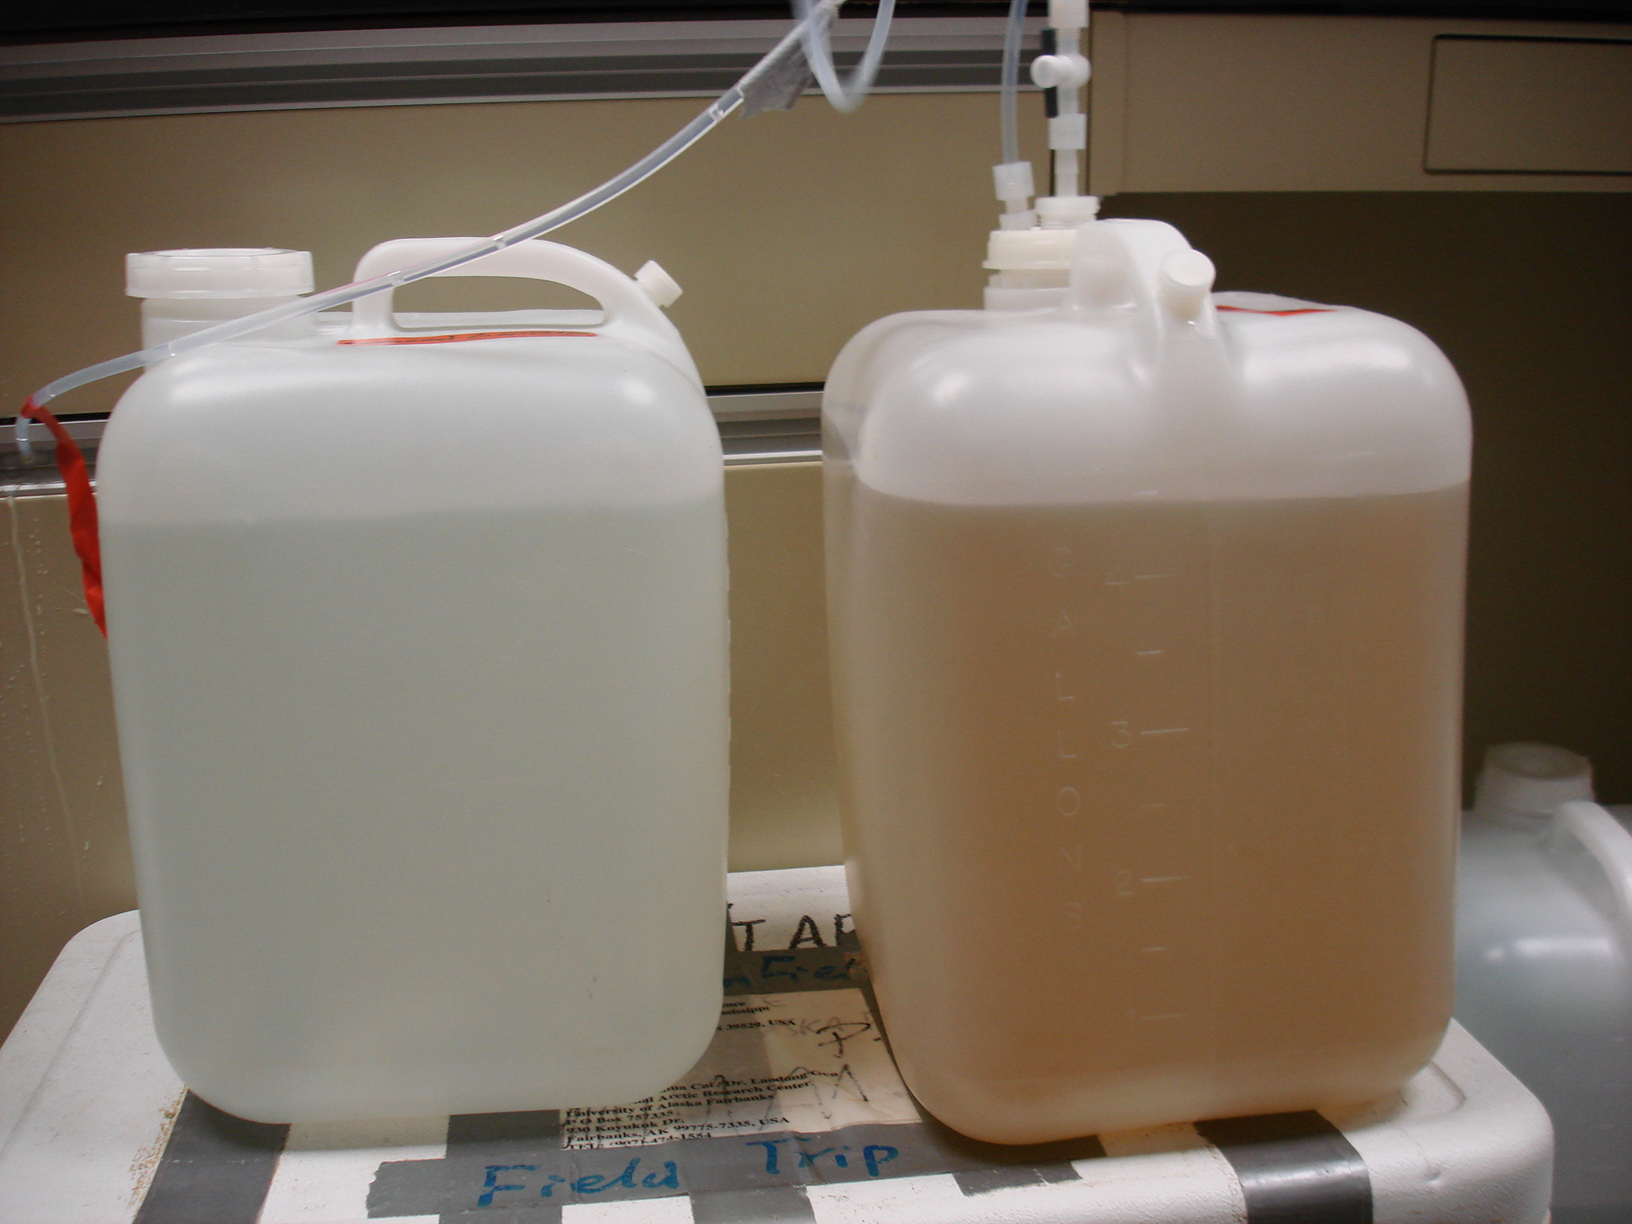
| Retentate vs. permeate from large volume ultrafiltration (up to 100 liters) for collecting nanoparticles /macromolecules or sufficient amounts of freeze dried COM samples for isotopic and molecular characterization | Atomic force microscopy image of aquatic colloids (from Santschi et al., 1998, L&O) |
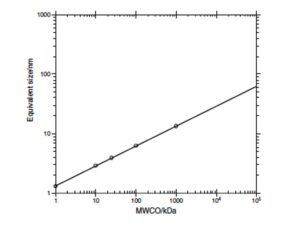
Relationship between molecular weight (in kDa) and size (in nm) of macromolecular dissolved organic matter (from Guo and Santschi, 2007, IUPAC Series). |
|
• Interactions of NOM with nanoparticles and metals
Natural organic matter (NOM) isolated using ultrafiltration and model macromolecular organic matter with different functional groups were used to understand the interactions between DOM and nanoparticles (see examples in Kteeba et al., 2017 ENPO; Baalousha et al., 2018, Environmental Science: Nano) and effects of NOM on surface properties and toxicity of nanoparticles in aquatic organisms (see examples below).
 |
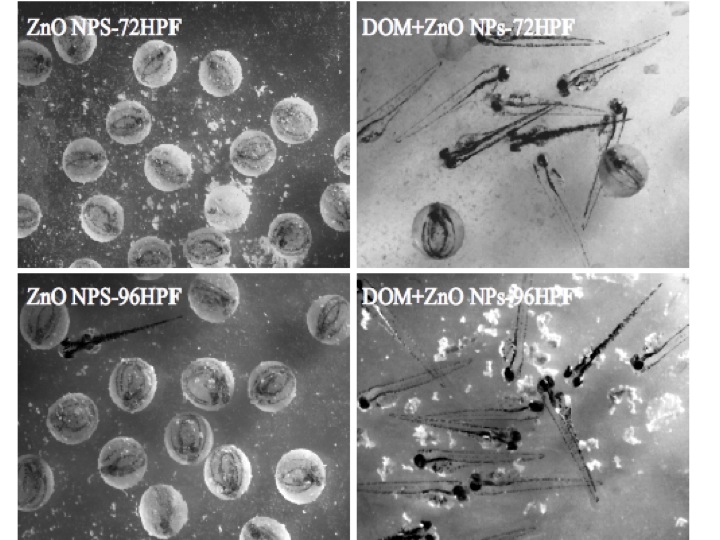 |
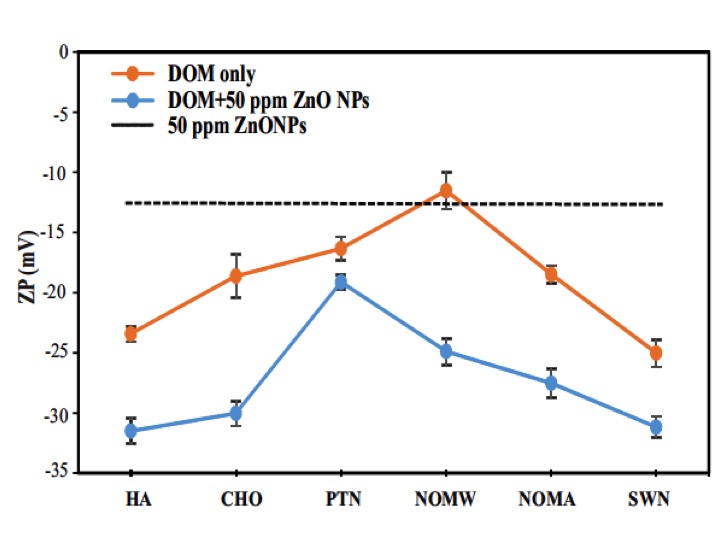
| Examples showing changes in zeta-potential of ZnO nanoparticles in the presence of different NOM and organic compound classes (from Kteeba et al. 2017, Environmental Pollution, ). | Examples showing the role of dissolved organic matter in remedying the toxicity of nanoparticles to Zebrafish (from Kteeba et al., 2017, Environmental Pollution). |
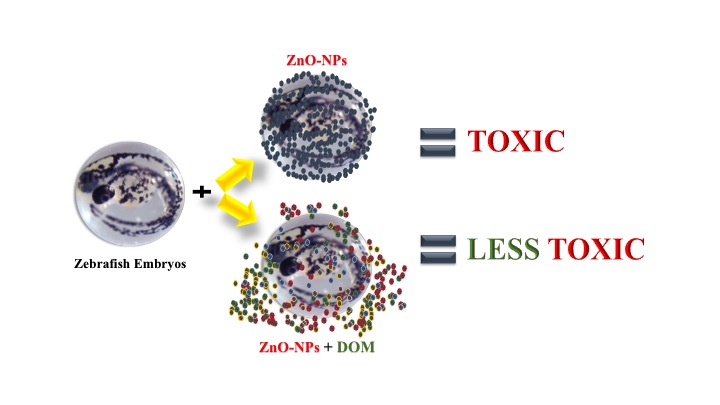 From Kteeba et al. (2017, Environ. Pollution) |
 Mitigative effects of natural and model DOM with different functionalities on the toxicity of methylmercury (Me-Hg) in embryonic zebrafish (Li et al., 2019, Environmental Pollution, 252, 616-626.) |
-
Reactivity, fate and transport of microplastics and nanoplastics in aquatic environments
 |
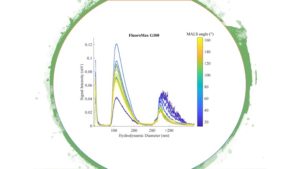 Size spectra of nanoplastics (FluoroMax G100) characterized using flow field-flow fractionation (FlFFF) coupled with MALS detectors. |
B. Instruments for Organic/Inorganic Characterization
- High resolution sector field ICP-MS (ThermoFisher Element 2).
- Asymmetric flow field-flow fractionation(AFlFFF) coupled with UV-absorbance, fluorescence, and MALS detectors.
- Shimadzu TOC-TN analyzer (TOC-L, TNM-L and ASI-L) — capable of measuring total C (including dissolved organic carbon and dissolved inorganic carbon) and TDN (total dissolved nitrogen) at the same time. See examples in Guo et al. (1995) and Guo and Macdonald (2006).
- Fluorescence spectroscopy for the measurements of excitation-emmision matrices (EEMs) (see examples in Zhou and Guo, 2012 ; Zhou et al. 2013; and Zhou et al. 2016).
- Agilent UV-vis spectrophotometer (Agilent 8453) – for the measurements of colored dissolved organic matter (CDOM) and other general chemical analyses (see examples in DeVilbiss et al. 2016; Zhou et al. 2016).
- Seal auto-analyzer (Model AA3) for measurements of nutrient species (NO3, NO2, NH3, DIP and dissolved silicate) in natural waters (e.g., Guo et al., 2004, Guo et al., 2012)
- Ion chromatography (IC) for anion and cation analysis.
- Dynamic light scattering (Malvern, Zetasizer/Nanosizer) for molecular size and Zeta potential measurements (e.g., Kteeba et al., 2016; Schutte et al. 2023)
- FT-IR spectroscopy (see examples in Lin et al. 2021)
- EA-IR-MS (Thermo-Fisher), GC-MS, LC-MS, Pyrolysis-GC-MS, HPLC, Scanning Electron Microscope (SEM), Raman Spectroscopy and other shared instruments (hourly charge).
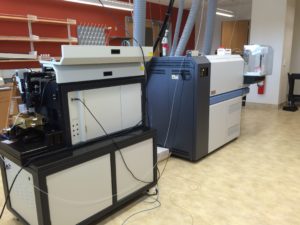 High resolution sector field ICP-MS (Thermo Scientific Element 2) with laser ablation. See examples of using FlFFF coupled with ICP-MS in Stolpe et al. (2013, GCA). |
 |
3-D fluorescence spectroscopy for the measurements of fluorescence excitation-emmision matrices (EEMs) of natural water samples (see examples in Zhou and Guo, 2012; Zhou et al., 2013; DeVilbiss et al., 2016; Zhou et al., 2016).
 |
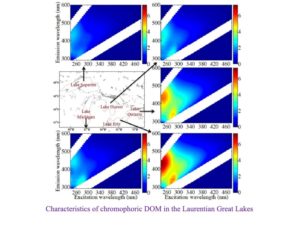 |
| Examples of using EEMs techniques coupled with PARAFAC analysis for DOM characterization in aquatic environments (from Zhou et al., 2013, Marine Chemistry, EEMs of oil and seawater samples from the Deep-water Horizon oil spill in the Gulf of Mexico). | Characteristics of chromophoric (fluorescent) dissolved organic matter (CDOM, FDOM) in the Laurentian Great Lakes (Zhou et al., 2016, JGLR) |
C. Instrumentation for radionuclides and stable isotopes
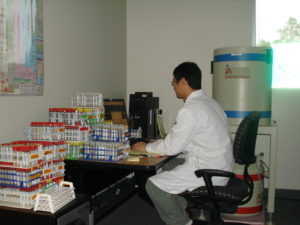
Canberra Gamma- and alpha- systems
- Canberra Gamma spectroscopy with ultra-high purity Ge well detector for the measurements of naturally occurring radionuclides and radioactive tracers such as Th-234, Pb-210, Be-7, Cs-137, I-131, Ra-226, Pa-133, etc.
- Canberra Alpha spectroscopy with 12 detectors for the measurements of Po-210, Th-228/Th-230/Th-232, Pu-239,240, and others
 |
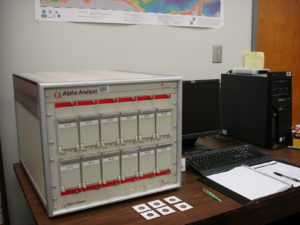 |
| Canberra Gamma spectroscopy | Canberra Alpha spectroscopy with 12 detectors |
 |
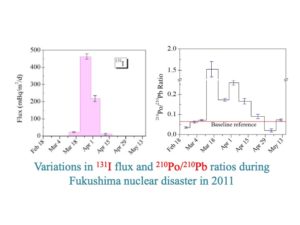 |
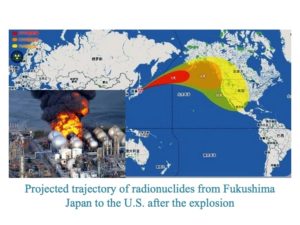
| Transport trajectory of radionuclides from Japan to the U.S. during the 2010 Fukushima nuclear disaster (upper) and major radionuclides identified in rainwater including Pb-210 (46 Kev), I-131 (364 Kev) and Be-7 (477 Kev). | Atmospheric flux ratios of 210Po to 210Pb, with anomalously high 210Po/210Pb ratios observed during maximum 131I fallout from Fukushima (see Yang and Guo, 2012, JER). |
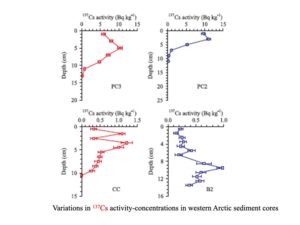 |
Examples of using fallout radionuclides such as Cs-137 and Pb-210 for sediment chronology and for quantifying sedimentation rates and material fluxes in aquatic environments (Yang and Guo, 2018, Continental Shelf Research) |
Stable isotope analyzer
- Picarro Cavity Ring Down Spectroscopy (L2130-i) for the analysis of oxygen and hydrogen stable isotopes (d18O and dD) to monitor variations in water isotopes (dD and d18O) in precipitation (rain and snow) and river waters (e.g., the Milwaukee River).
- ThermoFisher Delta V Isotope Ratio-Mass Spectrometer (3 kV) with elemental analyzer (Costech Instrument) for the measurements of stable carbon and nitrogen isotopes in particulate matter, sediments and soil samples (EA-IR-MS, shared instrument).
 |
Delta V Isotope Ratio-Mass Spectrometer (3 kV ) coupled with en elemental analyzer for total C, N and S analysis. |
D. Additional shared Instruments/Facilities in the School
- R/V Neeskay: provides year-round access to the Great Lakes and has a fully functional platform and floating laboratory
- Instrument Shop: a full-service electronics, fabrication, and machine shop where parts and full assemblies are custom made.
- McLane in-situ pumping system for collecting POM samples
- Sediment coring
- Other instrument
 |
 |
Related publications:
- Baalousha, M., Afshinnia, K, and Guo, L. 2018. Natural organic matter composition determines the molecular nature of nanomaterial NOM-corona. Environmental Science: Nano, 5, 868-881. Advance Article, doi: 10.1039/C8EN00018B.
- Chen, M., Wang, W.-X. and Guo, L. 2004. Phase partitioning and solubility of Fe in seawater controlled by dissolved organic matter.Global Biogeochemical Cycles, 18 (4), GB4013, doi: 10.10.29/2003GB002160.
- Kteeba, S.M., El-Adawi, H.I., El-Rayis, O.A., El-Ghobashy, A.E., Schuld, J.L., Svoboda, K.R., Guo, L.D.* 2017. Zinc oxide nanoparticle toxicity in embryonic zebrafish: Mitigation with different natural organic matter. Environmental Pollution, 230, 1125–1140. doi:10.1016/j.envpol.2017.07.042.
- Lin, P and Guo, L. 2016. Do invasive quagga mussels alter CO2 dynamics in the Laurentian Great Lakes? Scientific Reports, 6, article number: 39078. doi: 10.1038/srep39078.
- Lin, H., Xu, H., Cai, Y. Belzile, C. Macdonald, R.W. and Guo, L. 2021. Dynamic changes in size-fractionated dissolved organic matter composition from the seasonally ice-covered Yukon River as characterized using fluorescence EEM-PARAFAC, FT-IR and data fusion. Limnology and Oceanography, 66, 3085-3099. https://doi.org/10.1002/lno.11862
- Stolpe, B., Guo, L. Shiller, A. and Hassellov, M. 2010. Size and composition of colloidal organic matter and Fe in the Mississippi and Pearl River as characterized by flow field-flow fractionation techniques. Marine Chemistry, 118: 119-128, doi: 10.1016/j.marchem.2009.11.007.
- Stolpe, B., Guo, L. and Shiller, A.M. 2013. Binding and transport of rare earth elements by organic and iron-rich nanocolloids in Alaskan rivers, as revealed by field-flow fractionation and ICP-MS . Geochim. Cosmochim. Acta, 106, 446-462. http://dx.doi.org/10.1016/j.gca.2012.12.033.
- Xu, H.C. and Guo, L. 2017. Molecular size-dependent abundance and chemical composition of dissolved organic matter in river, lake and sea waters. Water Research, 117, 115-126. doi:10.1016/j.watres.2017.04.006.
- Xu, H, and Guo, L. 2018. Intriguing changes in molecular size and composition of dissolved organic matter induced by microbial degradation and self-assembly. Water Research, doi:10.1016/j.watres.2018.02.016.
- Yang, W., Guo, L., Chuang, C.Y., Santschi, P.H., Ayranov, M., Schumann, D. 2015. Influence of organic matter on the adsorption of 210Pb, 210Po and 7Be and fractionation on nanoparticles in seawater. Earth and Planetary Science Letters 423, 193-201, doi: 10.1016/j.epsl.2015.05.007.
- Yang, W. and Guo L. Sources and burial fluxes of soot black carbon in sediments on the Mackenzie, Chukchi, and Bering Shelves. Continental Shelf Research, 155, 1-10. doi: 10.1016/j.csr.2018.01.008.
- Zhou, Z. and Guo, L. 2015. A critical evaluation of an asymmetrical flow field-flow fractionation system for colloidal size characterization of natural dissolved organic matter. Journal of Chromatography A. 1399, 53-64, doi: 10.1016/j.chroma.2015.04.035.
- Zhou, Z., Stolpe, B., Guo, L., Shiller, A.M. 2016. Colloidal size spectra, composition and estuarine mixing behavior of DOM in river and estuarine waters of the northern Gulf of Mexico. Geochim. Cosmochim. Acta, 181, 1-17. doi: 10.1016/j.gca.2016.02.032.